TRX/USD Medium-term Trend: Bearish
- Supply zones: $0.04000, $0.05000, $0.06000
- Demand zones: $0.01000, $0.00900, $0.00800
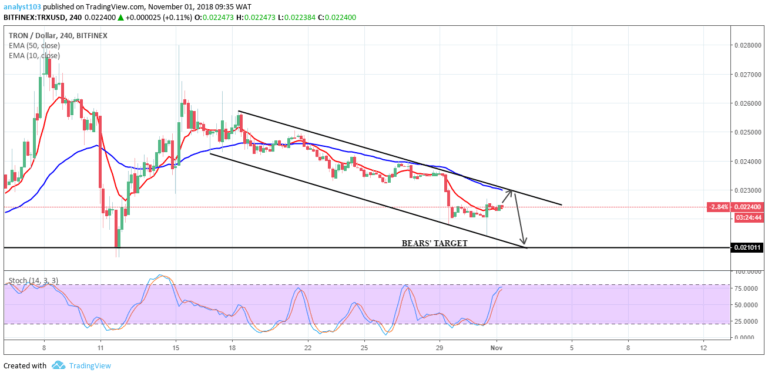
TRON is in a bearish trend in its medium-term outlook The bears’ pressure broke the lower demand area of yesterday’s range at $0.02450. This pushed the price further down to $0.02413 in the demand area butt a retest of the broken area was made.
Wicks – an indication of exhaustion – were seen in the area which further confirmed the bears return to continue the downward continuation in the medium-term.
The price is below the two EMAs and the EMAs are fanned apart which connotes strength in the context of the trend and in this case the downtrend. The stochastic oscillator is in the oversold region at 11% and it signals points down which suggest downward momentum in price.
TRX/USD Short-term Trend: Bearish
The cryptocurrency is in a bearish trend in its short-term outlook. The bullish pressure was lost at $0.02545 in the supply area as the bears took over due to the inverted hammer formation. TRXUSD dropped to $0.02413 in the demand area.
A minor pullback due to the bullish railroad set in late yesterday with the price up at $0.02474 in the supply area shortly after today’s opening.
The price is below the two EMAs and the stochastic oscillator signal points down at 38%. an indication of downward momentum in price in the short-term.
The views and opinions expressed here do not reflect that of CryptoGlobe.com and do not constitute financial advice. Always do your own research.


