

XMRUSD Medium-term Trend: Ranging
- Supply zones: $120, $130, $140
- Demand zones: $ 45, $40, $30
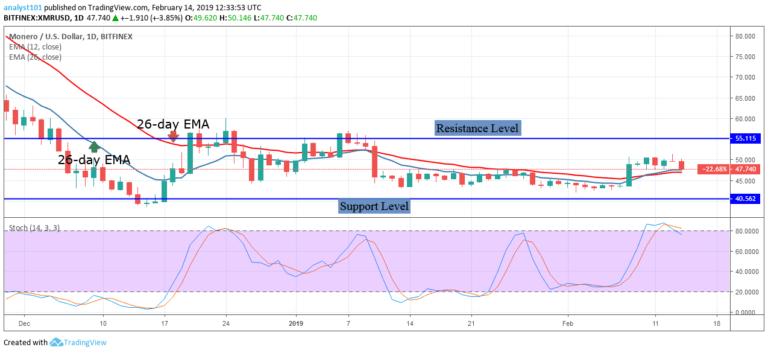
The price of Monero is still range bound between the levels of $40 and $55. The lower and upper price levels were yet to be broken since December 17, 2018. On February 17, the bulls broke the 12-day EMA, the 26-day EMA and reached a high of $54.29. This is the resistance zone of the upper price level.
Since the crypto’s price was resisted, the crypto is likely to resume its range bound movement. Traders should initiate short trades in anticipation of its range-bound movement. These short trades should be exited near the support zone of the lower price range. On the upside, if the bulls had broken the upper price level, traders should have initiated long trades in anticipation of a bullish trend.
Then a stop loss should be placed below the $55 price level. Meanwhile, the Stochastic is in the overbought region and below the 80% range. This indicates that the price is in a bearish momentum and a sell signal.
XMRUSD Short-term Trend: Bearish

On the 4- hour chart, the price of Monero is in a bullish trend. On February 19, the bulls reached the high of $54.12 but the crypto faces resistance at the $54 price level. The crypto’s price fell as the bears broke below the 12-day EMA and the 26-day EMA to reach the $50 price level. If the bearish trend continues the crypto will find support at $45 price level.
Meanwhile, the Stochastic is in the oversold region below the 40% range. This indicates that the price is in a bearish momentum and a sell signal..
The views and opinions expressed here do not reflect that of CryptoGlobe.com and do not constitute financial advice. Always do your own research.


