
XMR/USD Long-term Trend: Bullish
- Resistance levels: $120, $130, $140
- Support levels: $50, $40, $30
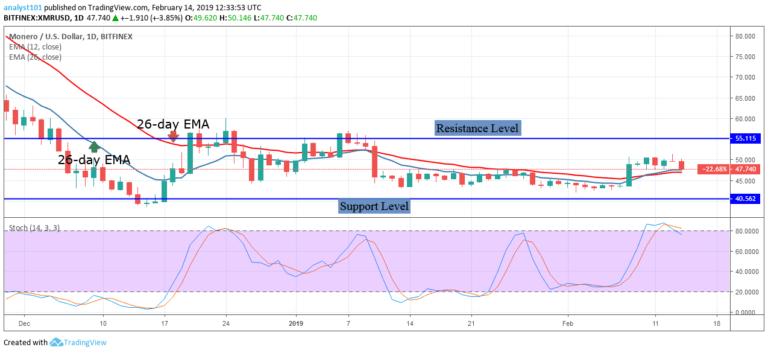
The price of Monero is in the bullish trend zone. On February 8, the crypto began trading above the 12-day EMA and the 26-day EMA. That is in the bullish trend zone. In retrospect, the price of Monero was in the bearish trend zone since January 10. At the bearish trend zone, the crypto was trading below the $46 price level.
Today the crypto is in the bullish trend zone, and it is trading above the $48 price level. On February 18, the crypto was in a bullish trend as the bulls broke the $50 resistance level and reached a high of $52 .On the upside, the crypto is likely to rise but may face resistance at $55 price level. Also, the bulls have to sustain a price above the EMAs. On the other hand, if the bears break below the EMAs, the crypto will fall to the bearish trend zone. In other words, resume its downward trend.

Meanwhile, the Stochastic indicator is in the overbought region but below the 80% range. This indicates that the crypto’s price is in a bullish momentum and a buy signal. The crypto’s price is above the 12-day EMA and the 26-day EMA which indicates that the price is in the bullish trend zone.
The views and opinions expressed here do not reflect that of CryptoGlobe.com and do not constitute financial advice. Always do your own research.


