
XMR/USD Long-term Trend: Ranging
- Resistance levels: $120, $130, $140
- Support levels: $40, $30, $20
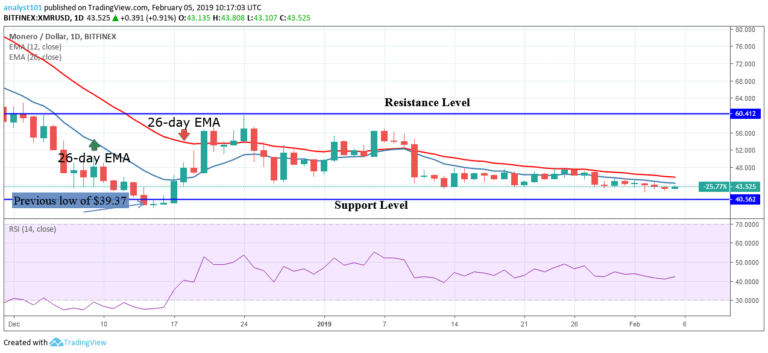
The price of Monero is now in the bullish trend zone. The cryptocurrency had been trading in the bearish trend since January 10. During the bearish trend zone, the crypto had been trading in a tight range between the levels of $43 and $47 in the last one month. Also, the crypto had been range bound since December 17, 2018, between the levels $40 and $55.
On February 8, the bulls broke the EMAs, the $47 resistance level and the price reached the $50.69 price level. The crypto’s price is likely to rise as the price is in the bullish trend zone. On the upside, the price of Monero is likely to reach the previous high of $60 but may face resistance at the $50 and $55 price levels. On the downside, if the bearish trend of yesterday continued and the bears break below the EMAs, the crypto will be in the bearish trend zone.

This will result in a further depreciation of the cryptocurrency. Meanwhile, the Stochastic indicator is in the overbought region but above the 80% range. This indicates that the crypto’s price is in a bullish momentum and a buy signal. The crypto’s price is above the 12-day EMA and the 26-day EMA which indicates that the price is in the bullish trend zone.
The views and opinions expressed here do not reflect that of CryptoGlobe.com and do not constitute financial advice. Always do your own research.


