
 Litecoin Chart by Trading View
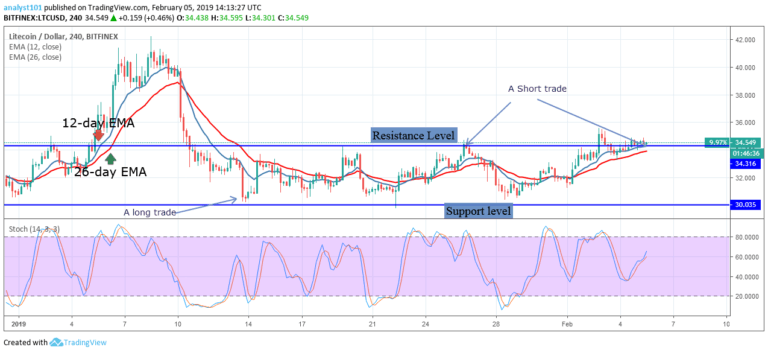
Medium-term Trend: Ranging
- Resistance Levels: $60, $65, $70
- Support Levels: $30, $25, $20
The price of Litecoin is range bound between the levels of $30 and $34. Today, the crypto’s price is facing resistance at the $34 price level. As a range-bound trader, you have to confirm whether the resistance level is holding. On the other hand, if there would be a price breakout. If the level holds, a short trade should be initiated and you exit your trades near the support zone.
Meanwhile, the Stochastic is above the 40% range which indicates that the crypto is in a bullish momentum and a buy signal.
LTCUSD Short-term Trend: Ranging
 Litecoin Chart by Trading View
On the 1-hour chart, the price of Litecoin is in the range. The crypto’s price faced resistance at the $34 price level, a trend line is drawn to determine whether the bullish trend is terminated. From the 1-hour chart, a bearish candlestick has broken the trend line and the following candlestick closed on the opposite of the trend line.
Therefore the bullish trend is terminated. The price is expected to fall into the range bound zone. Meanwhile, the MACD line and the signal line are above the zero line which indicates a buy signal.
The views and opinions expressed here do not reflect that of CryptoGlobe.com and do not constitute financial advice. Always do your own research.


