
 Litecoin Chart by Trading View
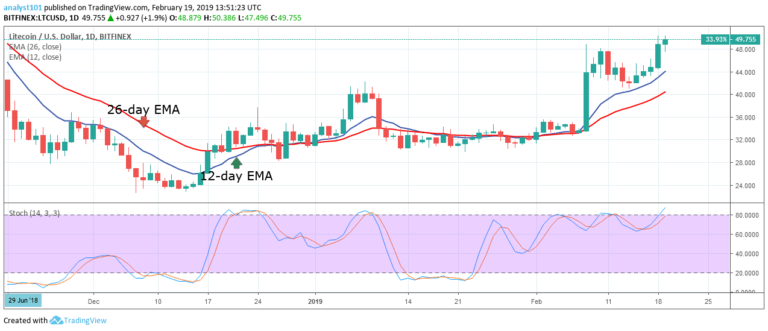
LTCUSD Medium-term Trend: Bullish
- Resistance Levels: $60, $65, $70
- Support Levels: $40, $35, $30
The LTCUSD pair is in the bullish trend zone. In retrospect, the price of Litecoin was range bound above the $30 price level since January 10, 2019. On February 8, the bulls broke out of the range-bound movement and reached a high of $48.10. The LTC price faced resistance at the $48 price level and the crypto fell to the support of 12-day EMA.
At the support of 12-day EMA, the bulls made another attempt at the resistance level at $48. On the upside, the crypto’s price is expected to rise if the bulls break the $48 resistance level. Meanwhile, the Stochastic is in the overbought region but below the 80% range which indicates that the crypto is in a bullish momentum and a buy signal.
LTCUSD Short-term Trend: Bullish
 Litecoin Chart by Trading View
On the 4-hour chart, the price of Litecoin is in a bullish trend. The crypto’s price was making a series of higher highs and higher lows when the trend line was broken at the $48 price level. From this chart, the bullish trend is terminated because the trend line has been broken and the following candlestick closed in the opposite of the trend line.
The bulls are still pushing towards the resistance level. Meanwhile, the Stochastic is in the overbought region but below the 80% range which indicates that the crypto is in a bullish momentum and a buy signal.
The views and opinions expressed here do not reflect that of CryptoGlobe.com and do not constitute financial advice. Always do your own research.


