
 Ethereum Chart By Trading View
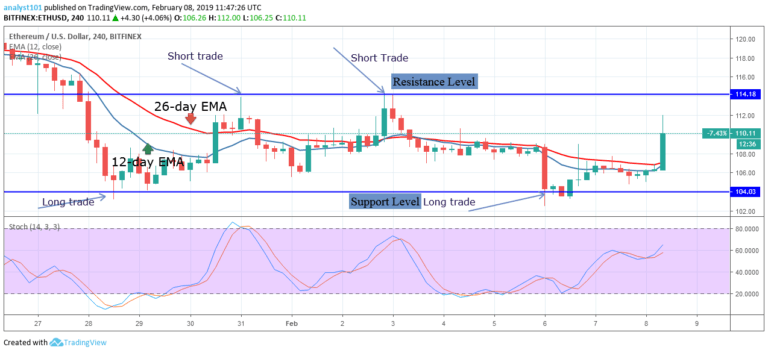
ETHUSD Medium-term Trend: Bearish
- Resistance Levels: $230, $240, $250
- Support Levels: $100, $90, $80
The price of Ethereum had been range bound between the levels of $104 and $114. The bulls have broken the 12-day EMA, the 26-day EMA and reached the bullish trend zone. The crypto’s price is likely to rise to reach the $120 price level. However, the crypto’s price may face resistance at the $114 price level. This is because the ETH price had been range bound since January 28, 2019.
If the bulls reach the resistance level and are repelled, traders should initiate short trades. This short order should be exited near the support zone. Presently, the crypto’s price is in a bullish trend. At the support level, a long order should have been initiated. This long order should be exited near the resistance zone.
Meanwhile, the stochastic band is out of the oversold region but above the 40% range which indicates that price is in a bullish momentum and a buy signal.
ETHUSD Short-term Trend: Bullish
 Ethereum Chart By Trading View
On the 1-hour chart, the price of Ethereum is in a bullish trend. Yesterday, the crypto’s price was ranging below the 12-day EMA and the 26-day EMA. Today, the bulls have broken the EMAs and the crypto price is now in the bullish trend zone. The crypto’s price has reached a high of $109 but will face resistance at $114 price level.
If the $114 resistance is broken, the crypto will reach the highs of $120 and $130. Meanwhile,the stochastic has reached the overbought region but below the 80% range which indicates that the price is in a bearish momentum and sells signal.
The views and opinions expressed here do not reflect that of CryptoGlobe.com and do not constitute financial advice. Always do your own research.


