
 Ethereum Chart By Trading View
ETHUSD Medium-term Trend: Bearish
- Resistance Levels: $230, $240, $250
- Support Levels: $100, $90, $80
On February 6, the bears broke the $105 price level which the bulls held in the last ten days. The ETH price had been in a tight range between the levels of $105.30 and $114.33. The bears broke the support level to the low of $104.36. The crypto’s price is now ranging horizontally at the $104 price level.On the downside, if the bearish trend continues, the crypto will further depreciate to the low of $100.
This is because the ETH price is in the bearish trend zone. On the upside, if the support level holds, the crypto may embark on a bullish movement to reach the range-bound levels of $105 and $114. Traders should look out for buy setups if the support level holds.Meanwhile, the stochastic band is in the oversold region but above the 20% range which indicates that price is in a bearish momentum and a sell signal.
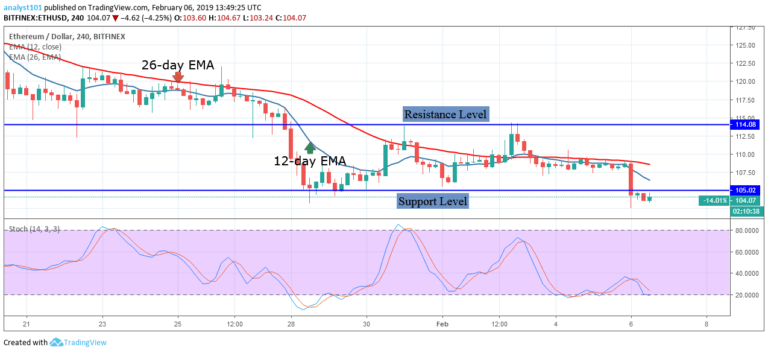
ETHUSD Short-term Trend: Bearish
 Ethereum Chart By Trading View
On the 1-hour chart, the price of Ethereum is in a sideways trend. On February 5, the crypto’s price was in a sideways trend; as the ETH price fluctuates above the $107 price level. On February 6, the bears broke the 12-day EMA and the 26-day EMA as price fell to the $104 price level. At the new support of $104, the crypto’s price began its range bound movement.
A bullish candlestick is attempting to break above the 12-day EMA. If the bulls break above the EMAs, the crypto will be in a bullish trend. On the other hand, if the bears break the $100 price level, the crypto will find support at the $85 price level.
The views and opinions expressed here do not reflect that of CryptoGlobe.com and do not constitute financial advice. Always do your own research.


