
 Ethereum Chart By Trading View
ETHUSD Medium-term Trend: Bullish
- Resistance Levels: $230, $240, $250
- Support Levels: $140, $130, $120
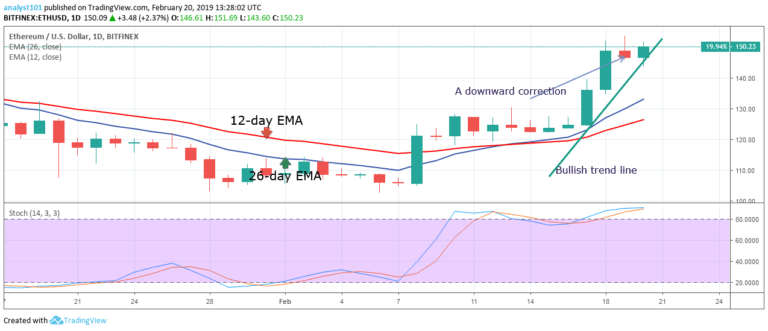
The price of Ethereum is still in a bullish trend after the price rally on February 8. The crypto’s price was also in a range bound movement for about a week after the February 8 price rally. On February 17, the bulls commenced a fresh bullish trend and reached a high of $148.87. The following day the crypto’s price had a downward correction to the low of $146.61.
Today, the bullish trend of ETH price is ongoing. The crypto’s price is likely to rise because the price is above the 12-day EMA and the 26-day EMA. However, the ETH price is likely to face resistance at the $150 price level. The $150 price level had not been broken since November 19, 2019.
On the upside, if the price is sustained above the EMAs and the $150 resistance level is broken the crypto will revisit the $160 price level. Meanwhile, the stochastic band is in the overbought region and above the 80% range which indicates that the price is in a strong bullish momentum and a buy signal.
ETHUSD Short-term Trend: Bullish
 Ethereum Chart By Trading View
On the 4-hour chart, the price of Ethereum is in a bullish trend. Yesterday, the crypto’s price was resisted at the $152 price level and the ETH price fell to a low of $145.49. The ETH price fell to the 12-day EMA and commenced a fresh bullish movement. The bulls are making another attempt at the $150 resistance level.
The crypto’s price is likely to rise because the price is above the EMAs. On the downside, if the bulls fail to break the $150 price level, the crypto’s price will be on a range bound movement.The stochastic is in the overbought region but below the 80% range which indicates that the price is in a bearish momentum and a sell signal.
The views and opinions expressed here do not reflect that of CryptoGlobe.com and do not constitute financial advice. Always do your own research.


