
 Ethereum Chart By Trading View
ETHUSD Medium-term Trend: Bullish
- Resistance Levels: $230, $240, $250
- Support Levels: $130, $120, $110
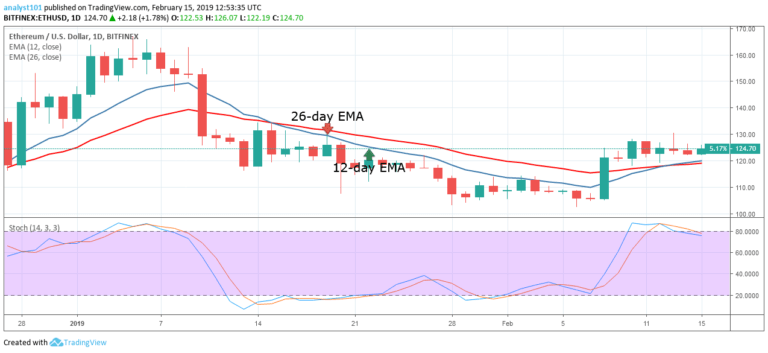
Last week, the price of Ethereum was ranging above the $120 price level. On February 8, the bulls broke the 12-day EMA, the 26-day EMA and the crypto’s price reached a high of $127.37. The bulls have succeeded in breaking the $130 resistance level which was unbroken since January 10. Today, the ETH price has commenced a series of higher highs and higher lows.
The crypto’s price is trading at $145.54 as at the time of writing. On the upside, the crypto’s price is expected to reach the highs of $160 and $200 price levels but may face resistance at the $160 price level. The ETH price should be sustained above the EMAs and the bulls break the $160 resistance level. Meanwhile, the stochastic band is in the overbought region but above the 80% range which indicates that the price is in a strong bullish momentum and a buy signal.
ETHUSD Short-term Trend: Ranging
 Ethereum Chart By Trading View
On the 4-hour chart, the price of Ethereum is in a sideways trend. The 12-day EMA and the 26-day EMA were trending horizontally as the crypto’s price was range bound above the $120 price level. Today, the price of Ethereum is in a smooth uptrend. The crypto’s price is making a series of higher highs and higher lows.
If the bulls sustained their momentum and break the $160 resistance level, the crypto will reach its previous high of $200.The stochastic is in the overbought region but above the 80% range which indicates that the price is in a strong bullish momentum and a buy signal.
The views and opinions expressed here do not reflect that of CryptoGlobe.com and do not constitute financial advice. Always do your own research.


