
 Ethereum Chart By Trading View
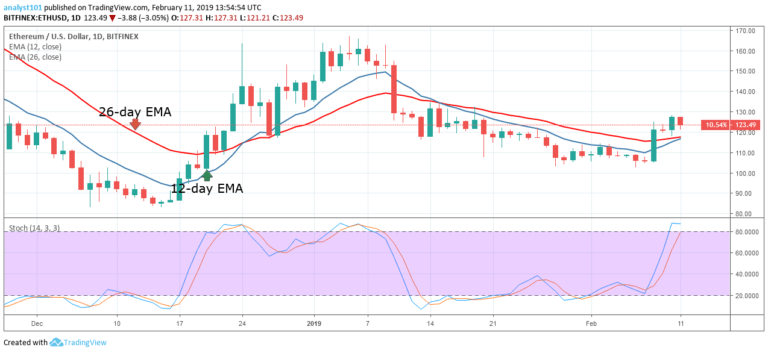
ETHUSD Medium-term Trend: Bullish
Resistance Levels: $230, $240, $250
Support Levels: $100, $90, $80
Last week, the price of Ethereum was in a tight range between the levels of $104 and $114. On February 8, the bulls break the $114 resistance level, and the crypto reached the $124.88 price level. The crypto’s price is above the EMAs which indicates that the price is likely to rise.
On the upside, if the bulls sustain a price above the EMAs, the crypto’s price will reach a high of $160 but will face resistance at the $128 price level. The crypto’s price is retracing after testing the resistance at $128. If the bearish trend continues and the bears break below the EMAs, the crypto will fall into the bearish trend zone.
Meanwhile, the stochastic band is in the overbought region but above the 80% range which indicates that price is in a strong bullish momentum and a buy signal.
ETHUSD Short-term Trend: Bullish
 Ethereum Chart By Trading View
On the 4-hour chart, the price of Ethereum is in a bullish trend. Last week, the 12-day EMA and the 26-day EMA were trending horizontally indicating a sideways trend. The crypto’s price was ranging above the $105 price level before the price breakout. On February 8, the crypto’s price was making a series of higher highs and higher lows before it was resisted at the $122 price level.
The crypto’s price retraced to the support of the 12-day EMA. The bulls made another attempt and reached a high of $128 but were resisted again. The crypto’s price is now ranging above the $120 price level. The stochastic is out of the overbought region but below the 60% range which indicates that the price is in a bearish momentum and a sell signal.
The views and opinions expressed here do not reflect that of CryptoGlobe.com and do not constitute financial advice. Always do your own research.


