
ETHUSD Long-term Trend – Ranging
- Distribution territories: $140, $160, $180
- Accumulation territories: $80, $60, $40
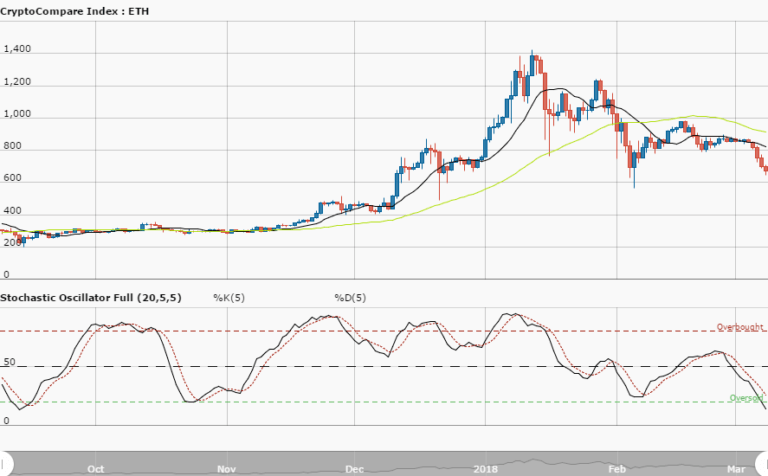
Ethereum’s price has been ranging within its trend. On February 3, the cryptocurrency’s price managed to touch its 14-day SMA, but its move upwards ended up shortly after as a bearish candlestick was soon formed.

Since then, the cryptocurrency’s price has been seeing various ups and downs. The 50-day SMA is located over the 14-day SMA, while the crypto’s price has dropped slightly. The Stochastic Oscillators are in ranges 40 and 60 pointing north, which could mean Ethereum’s price is set to see upward movements.
Pressure affecting Ethereum has apparently ben gradually fading away. While there are tendencies showing its price may come down to test the $80 mark, it may not break the 50-day SMA. Traders may want to wait for a strong price movement before entering a position.
The views and opinions expressed here do not reflect that of CryptoGlobe.com and do not constitute financial advice. Always do your own research.


