

ADAUSD Medium-term Trend: Bearish
- Resistance levels: $0.080, $0.090, $0.100
- Support levels: $0.040, $0.030, $0.020
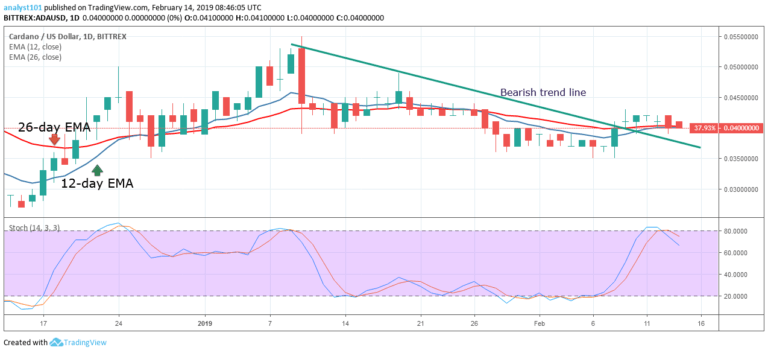
On February 17, the price of Cardano (ADA) was in a bullish trend, as it reached a high of $0.049. On February 24, it was in a bearish trend as the crypto was resisted in the upper level of its range, which saw the bears then break both its EMAs. ADA fell to a $0.041 low.
The next day, the bulls made a pullback above the 12-day EMA and the 26-day EMA but faced resistance. The crypto’s price is currently below the EMAs which indicates its price is likely going to fall. Meanwhile, the Stochastic is in the oversold region and below 40, which indicate ADA is in a bearish trend, and is a sell signal.
ADAUSD Short-term Trend: Ranging

On the 4-hour chart, the crypto’s price is in a bearish trend. Cardano has been ranging between $0.035 and $0.050 in the last three months. The bulls are yet to break the $0.05 mark, and the bears are yet to break the $0.035 mark.
Traders should’ve went short as the crypto’s price is range-bound. These shorts should be exited near the lower area of ADA’s range. If the cryptocurrency is close to it, traders could go long. Its Stochastic is in the oversold region below 50, indicating Cardano is in a bearish trend, a sell signal.
The views and opinions expressed here do not reflect that of CryptoGlobe.com and do not constitute financial advice. Always do your own research.


