

BTCUSD Medium-term Trend: Bearish
- Resistance levels: $7,000, $7,200, $7,400
- Support levels: $3,400, $3,200, $3,000
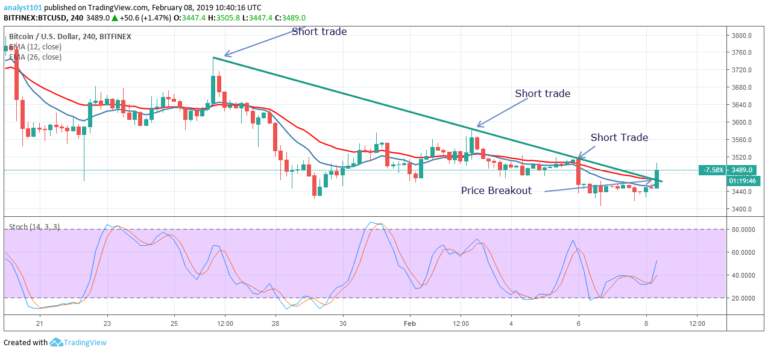
Yesterday, the BTC price was in the bearish trend zone. The crypto’s price was ranging below the 12-day EMA and the 26-day EMA at the $3,400 price level. Today, the bulls have broken the bearish trend line. The understanding is that if price breaks the trend line and the following candlestick closes on the opposite of it, the trend is said to be terminated.
We have seen the price breaking the trend line but we have not seen the following candlestick closing after it. It will be difficult to make any conclusions until the next analysis. Meanwhile, the stochastic band is out of the oversold region but above the 40% range which indicates that the crypto is in a bullish momentum and a buy signal.
BTC/USD Short-term Trend: Bearish

On the 1-hour chart, the price of Bitcoin is in a bearish trend zone. On February 8, the bulls broke the 12-day EMA, the 26-day EMA, and the bearish trend line. Here, the theory on the trend line tool application has been fulfilled but lower time frames are not reliable.
Technically, it is assumed that the bearish trend is terminated because we can see the first candlestick that broke the trend line and the following candlestick that closed after it. Traders are to look out for buy setups to initiate long trades.The stochastic band has reached the overbought region and above the 80% range which indicates that the price is in a strong bullish momentum and a buy signal.
The views and opinions expressed here do not reflect that of CryptoGlobe.com and do not constitute financial advice. Always do your own research.


