

BTCUSD Medium-term Trend: Bullish
- Resistance levels: $7,000, $7,200, $7,400
- Support levels: $3,700, $3,500, $3,300
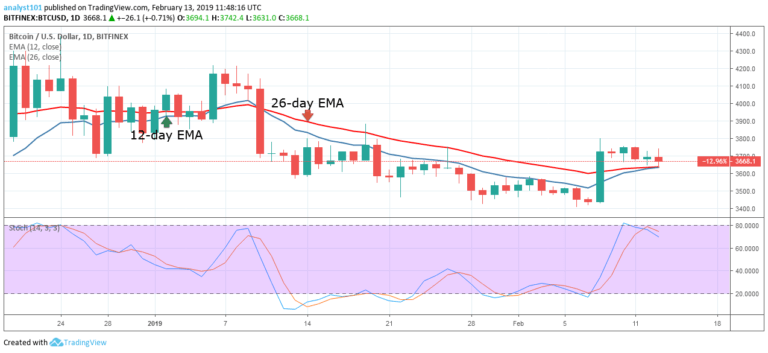
The price of Bitcoin is still in the bullish trend zone after the February 8 price rally. There is a fresh upward price movement after the range bound movement. The crypto’s price is making a series of higher highs and higher lows as the price rises from the $3,700 to the $4,000 price levels. The BTC price is likely to face resistance at the $4,200 price level.
If the bulls face resistance at that price level, the crypto will be forced to a range bound movement. On the upside, if the bulls have a price breakout, the crypto will revisit the highs of $4,500 and $5,000 price levels. Meanwhile, the stochastic band is at the overbought region and above the 80% range which indicates that the crypto is in a strong bullish momentum and a buy signal.
BTC/USD Short-term Trend: Bullish

On the 4-hour chart, the price of Bitcoin is in a bullish trend zone. The BTC price is in a smooth uptrend. The crypto’s price is trading at $4,034 and approaching the resistance level. Nevertheless, since on November 24, the bulls have not been able to break above the $4,200 resistance level.
The crypto’s price is likely to rise if more buyers come in at the $4,000 price level. A price breakout will make the price of Bitcoin to appreciate in value and attract more buyers. Meanwhile, the stochastic band is at the overbought region and above the 80% range which indicates that the crypto is in a strong bullish momentum and a buy signal.
The views and opinions expressed here do not reflect that of CryptoGlobe.com and do not constitute financial advice. Always do your own research.


