
BTCUSD Long-term Trend – Ranging
- Distribution territories: $4,500, $5,000, $5,500
- Accumulation territories: $2,500, $2,000, $1,500
On January 28, bitcoin’s price was dragged southwards past a low seen the past week, which saw it enter a new range. Bitcoin’s price is now trading between the $3,500 and $3,000 marks.

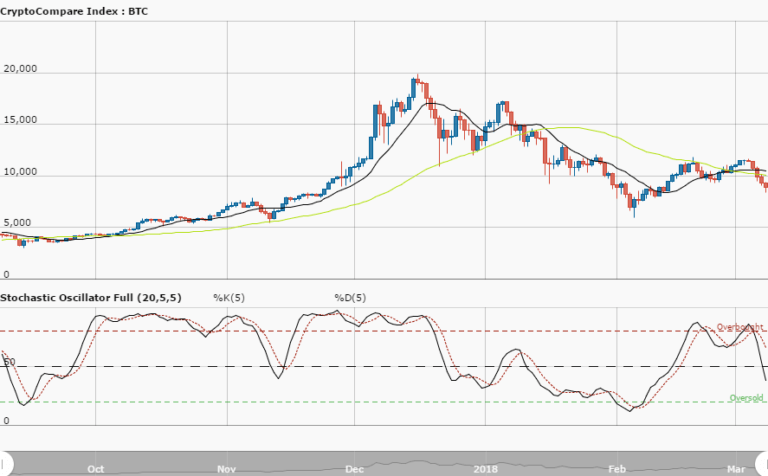
The cryptocurrency’s 14-day Sma is located close to the $3,500 mark, while the 50-day SMA is above the 14-day SMA, although the space between them is small. The Stochastic Oscillators have crossed and are seemingly attempting to consolidate around range 20.
Taking these indicators into account, the flagship cryptocurrency could see its price go further down. If that happens, traders are advised to stop trading until a strong price movement helps bitcoin’s price action reemerge, in order to have a clearer picture of where the market may go next.
The views and opinions expressed here do not reflect that of CryptoGlobe.com and do not constitute financial advice. Always do your own research.


