

XRPUSD Medium-term Trend: Ranging
- Resistance Levels: $0.56, $0.58, $ 0.60
- Support Levels: $0.36, $0.34, $0.32
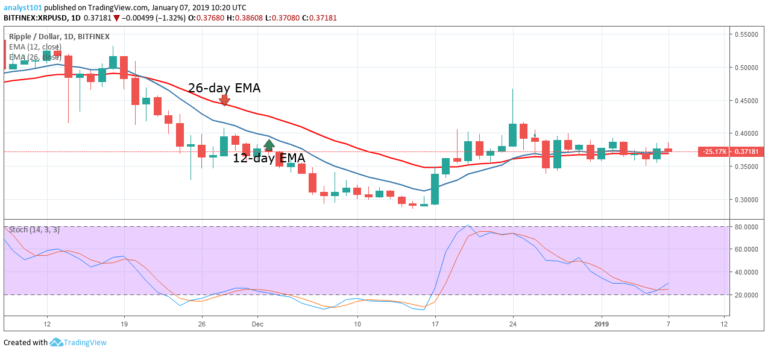
Last week the XRPUSD pair was range bound between the levels of $0.35 and $0.38. On January 6, the bulls broke the 12-day EMA , the 26-day EMA and the price came back to the bullish trend zone. Today, the crypto is well supported above the EMAs as the bulls are attempting to break the $0.38 price level. The XRP price is likely to rise because it is above the 12-day EMA and the 26-day EMA .
Secondly, the Stochastic indicator is above the 20% range indicating that the XRP price is in a bullish momentum and a buy signal. The blue band is above the red band indicating that the previous bearish trend is reversing. If the bulls breaks the $0.38 price level, the crypto is likely to commence its uptrend.
XRPUSD Short-term Trend: Bearish

On the 4-hour chart, the XRP price is in the bullish trend zone. Today, the bulls and the bears are still struggling between the levels of $0.37 and $0.38 . However, the bears are attempting to break the EMAs at the $0.37 price level. If the bears succeed, the crypto will fall to the lows of $0.36 or $0.34. Meanwhile, the Relative Strength Index period 14 is level 50 which indicates that the crypto is in a sideways trend.
The views and opinions expressed here do not reflect that of CryptoGlobe.com and do not constitute financial advice. Always do your own research.


