
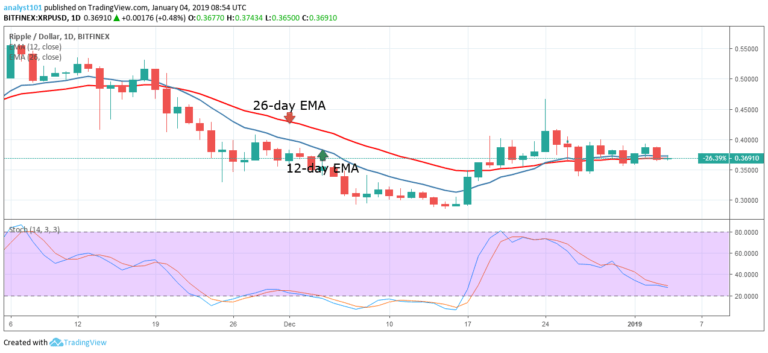

XRPUSD Medium-term Trend: Ranging
- Resistance Levels: $0.56, $0.58, $0.60
- Support Levels: $0.36, $0.34, $0.32
The XRPUSD pair had continued with its range bound movement in the last ten days. Yesterday, January 3, the XRPUSD pair was in a bearish trend as the crypto’s price fell to the low of $ 0.36. Today, the price has moved up to the $0.37 price level, only to be resisted at the $0.38 price level.
We have to watch out for two critical levels as the price break out from these levels . On the upside, if the bulls break out of the resistance level at $0.38, the price will reach the levels of $0.40 and $0.44. Traders can place a buy stop which is a pending order above the $0.38 price level. Also, a stop loss below the $0.38 price level in case false breakout. On the downside, if the bears break the $0.34 price level, the crypto will find support at either $0.28 and $0.24. Thereafter, traders should look out for buy setups to initiate long trades.
XRPUSD Short-term Trend: Bearish

On the 4-hour chart, the XRP price is in the bearish trend zone. On January 3, the bears broke the 12-day EMA and the 26-day EMA to the low of $0.36. However, the bulls are making a bullish movement to the EMAs. Meanwhile, the stochastic is above the 20% range indicating the XRP price is in a bullish momentum and a buy signal. Also, the crypto’s price is below the 12-day EMA and the 26-day EMA indicating that the price is in the bearish trend zone.
The views and opinions expressed here do not reflect that of CryptoGlobe.com and do not constitute financial advice. Always do your own research.


