

XRPUSD Medium-term Trend: Bearish
- Resistance Levels: $0.56, $0.58, $ 0.60
- Support Levels: $0.27, $0.25, $0.23
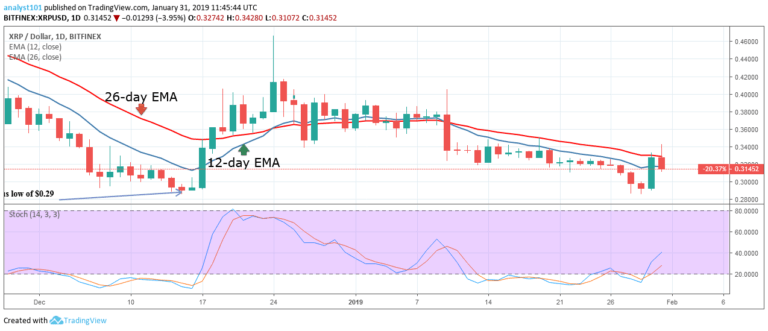
The price is still in the bearish trend zone. On January 29, the crypto’s price fell to its low at $0.29 and was relatively stable for 48 hours before the bullish trend. On January 30, the bulls took price to the high of $0.34 and attempted to break the 26-day EMA. Today, the 26-day EMA has resisted the crypto’s price and it is in a downward fall.
On the downside, the bears will revisit the previous low as price continue its falling. On the upside, the crypto will first break the EMAs and remain above it before the resumption of bullish trend. Meanwhile, the stochastic indicator is out of the oversold region but above the 20% range which indicates that price is in a bullish momentum and a buy signal.
XRPUSD Short-term Trend: Bearish

On the 4-hour chart, the XRP price is in the bullish trend zone. On January 29, the XRP price fell to its previous low at $0.28 as the bulls broke the 12-day EMA and the 26-day EMA to reach the bullish trend zone. Expectantly the crypto appreciated in the bullish trend zone as the price reached the $0.34 price level.
On the downside, the crypto faces the risk of falling again to its previous low of $0.28 or $0.29; if the bears break below the EMAs as a result of the resistance at $0.34. Meanwhile, the stochastic indicator is out of the overbought region but below the 80% range which indicates that the price is in a bearish momentum and a sell signal.
The views and opinions expressed here do not reflect that of CryptoGlobe.com and do not constitute financial advice. Always do your own research.


