

XRPUSD Medium-term Trend: Ranging
- Resistance Levels: $0.56, $0.58, $ 0.60
- Support Levels: $0.36, $0.34, $0.32
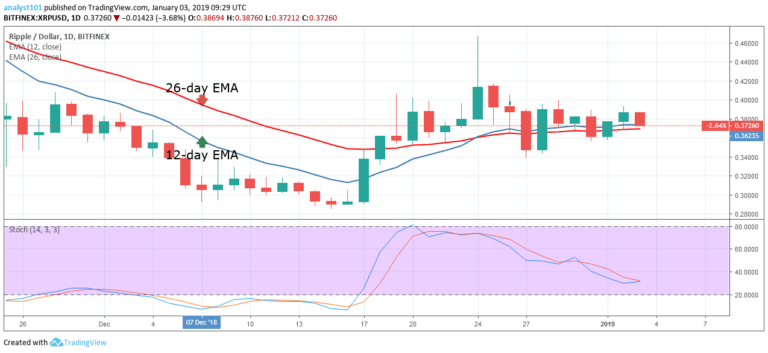
On December 24, 2018, the 12-day EMA crossed over the 26-day EMA to trend horizontally. Similarly, within the same period, the XRPprice had been range between the levels of $0.34 and $0.38. The bears had not been able to go beyond the closing price of $0.34. Also, the bulls had not been able to break the resistance at $0.38.
However, if more buyers come in at the $0.38 price level, the crypto will rise above the $0.40 price level. On the downside, if sellers come in at $0.34 price level, the bears will revisit the lows of $0.28 and $0.24. Meanwhile, the stochastic indicator is out of out of the overbought region but below 60% range which indicates that the crypto is in a bearish momentum and a sell signal.
XRPUSD Short-term Trend: Bullish

On the 4-hour chart, the XRP price is in a bullish trend. On January 1, the XRP price made a bullish movement to the high of $0.39 on January 2nd. The bullish trend was terminated at the resistance of $0.38. In other words, the bearish candlestick broke the trend line and the following candlestick closed on the opposite of it.
This confirms the range bound movement between the levels of $0.34 and the $0.38. Meanwhile, the stochastic is below 80% indicating that the XRP price is in a bearish momentum.
The views and opinions expressed here do not reflect that of CryptoGlobe.com and do not constitute financial advice. Always do your own research.


