

XRPUSD Medium-term Trend: Ranging
- Resistance Levels: $0.56, $0.58, $ 0.60
- Support Levels: $0.30, $0.28, $0.26
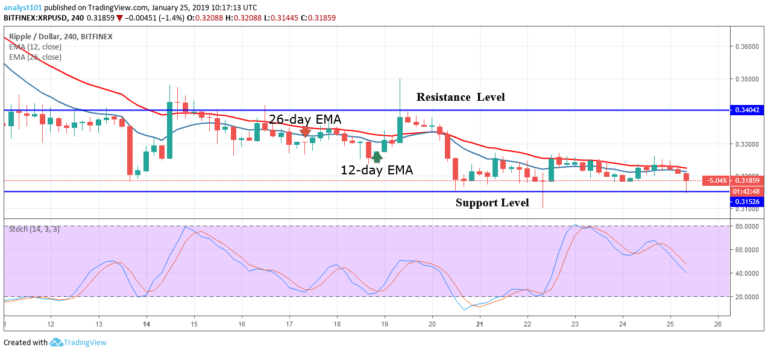
The XRP price was in a bullish trend zone yesterday. From the chart, the $0.32 price level has been the major resistance on a daily basis. On January 21, the bulls took price to the $0.32 price level and were resisted by the 12-day EMA. The crypto’s price fell to the low of $0.31. This has been the scenario since January 20.
The XRP price has been trading in the support zone because of the tight range bound movement. Today, there is another price rejection at the resistance level, the crypto’s price fell to the $0.31 price level. If a price breakdown occurs at this level, the crypto will find support at the $0.28 price level. Meanwhile, the stochastic is out of the overbought region but below the 60% range which indicates that the crypto is in a bearish momentum and a sell signal.
XRPUSD Short-term Trend: Ranging

On the 1-hour chart, the XRP price is in the bearish trend zone. The XRP price is trading in the support zone. From the price action, the crypto’s price is below the 12-day EMA and the 26-day EMA which indicates that the price is in the bearish trend zone. The crypto is prone to depreciation in this present circumstance.
Meanwhile, the stochastic indicator is above the 20% range which indicates that the crypto is in a bullish momentum and a buy signal.
The views and opinions expressed here do not reflect that of CryptoGlobe.com and do not constitute financial advice. Always do your own research.


