

XRPUSD Medium-term Trend: Ranging
- Resistance Levels: $0.56, $0.58, $ 0.60
- Support Levels: $0.30, $0.28, $0.26
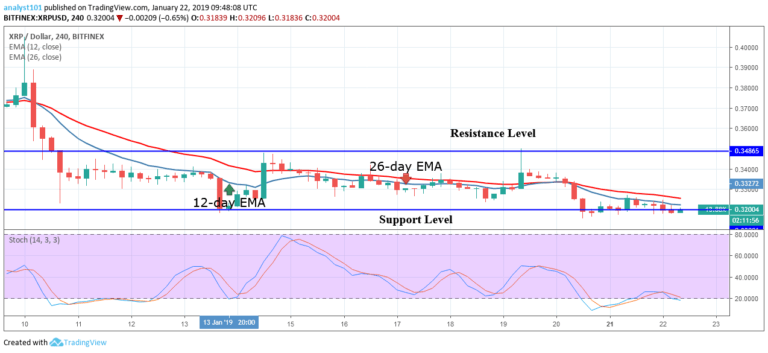
The XRPUSD pair had been in a range bound movement between the levels of $0.32 and $0.34 in the last two weeks. From the chart, the crypto is ranging above and below the $0.32 price level in the last 48 hours. What we are expecting is either a bullish breakout or bearish breakout. From all the indicators, the price breakout is likely to be in favor of the bears.
The crypto’s price is below the 12-day EMA and the 26-day EMA which indicates that the price is in the bearish zone. Another reason is that the stochastic bands are in the oversold region below the 20% range which indicates that XRP is in a bearish momentum. If we have a bearish breakout, the crypto may depreciate further to the low of $0.28 price level.
Similarly, a bullish breakout will make XRP price appreciate to the high of $0.38 and $0.40 price levels.
XRPUSD Short-term Trend: Ranging

On the 1-hour chart, the XRP price is in the bearish trend zone. The crypto’s price is below the 12-day EMA and the 26-day EMA but it fluctuates at the $0.32 price level. However, if we have more sellers at this price level, the crypto will fall. On the other hand, if we more buyers at this price level, the crypto will resume its bullish trend.
Meanwhile, the stochastic indicator is above the 20% range which indicates that the crypto is in a bullish momentum and a buy signal.
The views and opinions expressed here do not reflect that of CryptoGlobe.com and do not constitute financial advice. Always do your own research.


