

XRPUSD Medium-term Trend: Ranging
- Resistance Levels: $0.56, $0.58, $ 0.60
- Support Levels: $0.36, $0.34, $0.32
The XRPUSD pair had been in a sideways trend; as the price fluctuated between the levels of $0.36 and the $ 0.37 in the last five days. The crypto’s price had been attempting to break the $0.38 price level but to no avail. On December 27, the bears took price to the low of $0.34 which was well supported at that price level.
The following day the bulls took price to the high of $0.38 and the range bound movement continued. Now on the downside, if the price falls to the low of $0.33 and breaks the $0.33 price level, the crypto will be weakened. The crypto may find support at $0.28 price level. On the upside, if the bulls were able to scale over the $0.38 price level, the crypto may reach the highs of $0.40 and $0.45.
XRPUSD Short-term Trend: Ranging

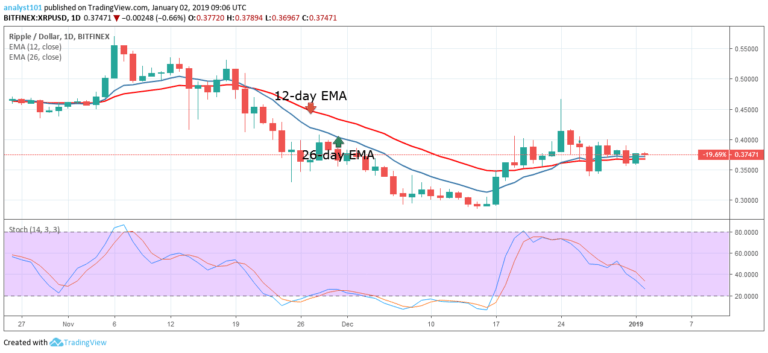
On the 4-hour chart, the XRP price is in a sideways trend. On January 1, the XRP price broke the 12-day EMA ,the 26-day EMA and reached the high of $0.37 price level. The price of XRP retraced to the 26-day EMA and commenced a bullish movement. A price breakout is expected at the lower and the upper levels of the price range.
Meanwhile, the stochastic is out of the oversold region and it is approaching the 60% range which indicates that the crypto is in a bullish momentum and a buy signal.
The views and opinions expressed here do not reflect that of CryptoGlobe.com and do not constitute financial advice. Always do your own research.


