

XRPUSD Medium-term Trend: Bearish
- Resistance Levels: $0.56, $0.58, $ 0.60
- Support Levels: $0.30, $0.28, $0.26
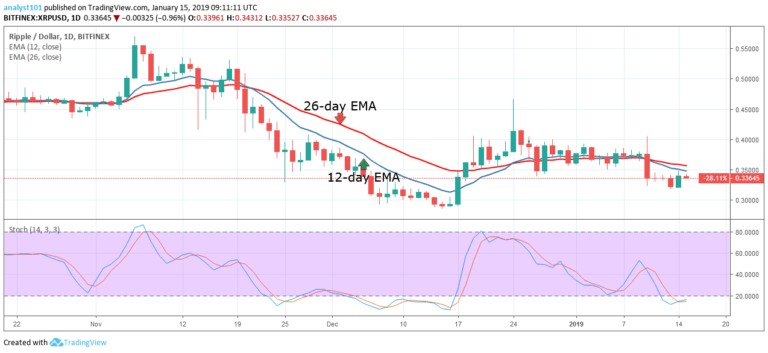
Yesterday, the XRP price was in the bearish trend zone. The XRP price recovered part of the losses it had when the price fell to the low of $0.32. During the recovery, the crypto’s price was unable to break the $0.33 price level. Meanwhile, the crypto’s price is below the 12-day EMA and the 26-day EMA indicating that XRP price is likely to fall.
The moving averages are pointing southward instead of the horizontal pattern. Also, the stochastic indicator is still in the oversold region and below the 20% range.This indicates that the XRP price is in a strong bearish momentum. If these indicators come through, the crypto is likely to fall to revisit previous low of December 15.
XRPUSD Short-term Trend: Bearish

On the 4-hour chart, the XRP price was in the bullish trend zone as the bulls broke the 12-day EMA and the 26-day EMA. Yesterday, the XRP price reached the high of $0.34 but the bears pulled back to the $0.33 price level. However, if the bears break below the 12-day EMA and the 26-day, the crypto will likely resume its downtrend.
Meanwhile, the stochastic indicator is out of the oversold region but below the 80% range indicating that the XRP price is in a bearish momentum and a sell signal.
The views and opinions expressed here do not reflect that of CryptoGlobe.com and do not constitute financial advice. Always do your own research.


