

XRPUSD Medium-term Trend: Bearish
- Resistance Levels: $0.56, $0.58, $ 0.60
- Support Levels: $0.33, $0.31, $0.29
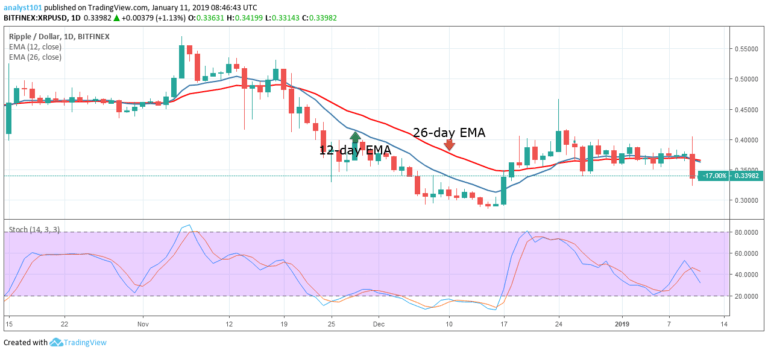
Yesterday, the XRP price was in a price rally where the bears had the upper hand. The crypto’s price fell to the low of $0.33 price level. This brings to an end the tight range bound movement we had been experiencing at the $0.37 and $0.38 price levels. Today, the crypto’s price is consolidating at the $0.33 price level for another price movement.
This was the exact price level at the low of December 5. Meanwhile, the XRP price is below the 12-day EMA and the 26-day EMA indicating that the crypto is likely to fall. It is also expected that the crypto may likely revisit the $0.29 price level of December 15. Therefore, traders should look out for buy setups to initiate long trades in anticipation of a bullish trend.
XRPUSD Short-term Trend: Bearish

On the 4-hour chart, the XRP price is in the bearish trend zone. From the chart, the bulls had reached the $0.40 price level, before the bears brought the price to the low of $0.33 price level. The crypto’s price is making a bullish movement to test the EMAs.
Meanwhile, the stochastic indicator is in the oversold region but below the 20% range indicating that the XRP price is in a bearish momentum and a sell signal.
The views and opinions expressed here do not reflect that of CryptoGlobe.com and do not constitute financial advice. Always do your own research.


