

XRPUSD Medium-term Trend: Bearish
- Resistance Levels: $0.56, $0.58, $ 0.60
- Support Levels: $0.36, $0.34, $0.32
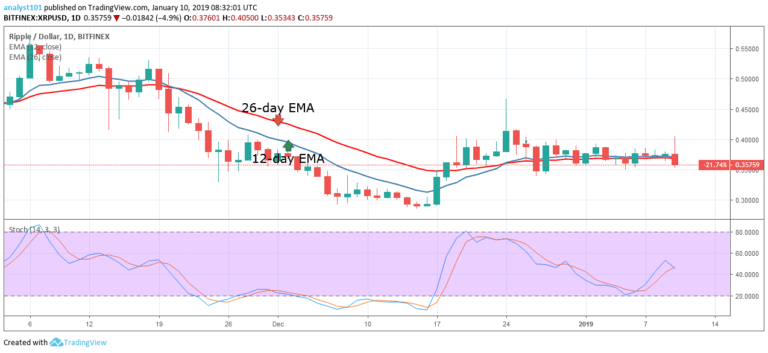
The XRPUSD pair had been range bound for days but fell to the bearish trend zone yesterday.The crypto’s price was in a bullish trend that resulted in a price rally. The bullish trend was short lived as the bears took the price from the high of $0.40 to the low of $0.36. The crypto’s price is now below the 12-day EMA and the 26-day EMA which indicates that the XRP price is likely to fall again.
Nevertheless, the XRP price has one more bearish step to take. If the bears break and fall below the $0.35 price level, the crypto is likely to find support at the $0.33 and $0.29 price levels. If the price falls to these levels, traders should look out for buy setups to initiate long trades.
Meanwhile, the stochastic is out of the oversold region but below the 60% range as the blue stochastic band makes a U-turn. This indicates that the crypto is in a bearish momentum and a sell signal.
XRPUSD Short-term Trend: Bearish

On the 4-hour chart, the XRP price is in the bearish trend. From the chart, the crypto’s price is falling and it is approaching the low of $0.35 price level. The 12-day EMA and the 26-day EMA are now pointing southward indicating that the crypto is in a bearish trend.
Meanwhile, stochastic is out of the overbought region but below the 40% range which indicates that the crypto is in a bearish momentum and a sell signal.
The views and opinions expressed here do not reflect that of CryptoGlobe.com and do not constitute financial advice. Always do your own research.


