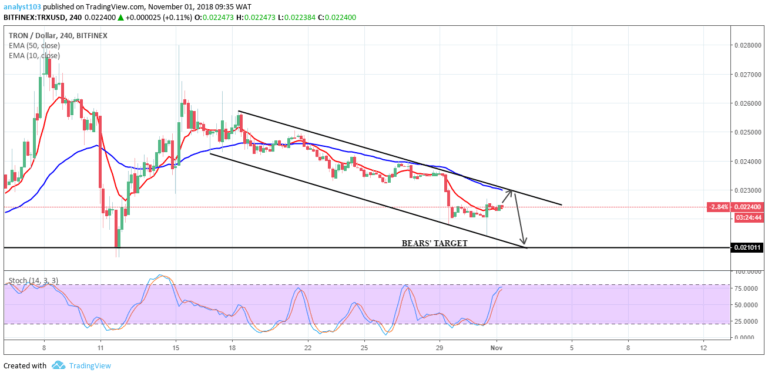
TRX/USD Medium-term Trend: Bearish
- Supply zones: $0.04000, $0.05000, $0.06000
- Demand zones: $0.01000, $0.00900, $0.00800
TRON is in a bearish trend in its medium-term outlook. After the $0.03000 in the supply area predicted in last week’s analysis was nicely tested on 27th January. The coin went further up to $0.03122 in the supply area before exhaustion set in with the formation of a bearish pinbar at $ 0.03014. The bears took control of the market. TRXUSD was down to $0.02876 yesterday.
Today’s 4-hour opening candle at $0.02935 closes as a bearish marubozu candle that broke the two EMAs, an indication of strong bearish pressure. TRXUSD later dropped to $0.02544 in the demand area as the bearish momentum increases in the medium-term.
The double top formation is seen an indication of bears dominance. $0.02400 may be retested as an initial target before the next demand area at $0.02122.
TRX/USD Short-term Trend: Bearish
The cryptocurrency is in a bearish trend in its short-term outlook. The bears’ takeover of the market was confirmed by the bearish candle at $0.02910 after the break at the two EMAs. TRXUSD dropped initially to $0.02682 and later to $0.02544 in the demand area.
The break of the key supply area and subsequent retest was an indication of downward trend continuation. The stochastic oscillator signal points down at 33%. This further confirms the downward momentum in price of the cryptocurrency as the bearish pressure becomes much stronger in the short-term.
The views and opinions expressed here do not reflect that of CryptoGlobe.com and do not constitute financial advice. Always do your own research.


