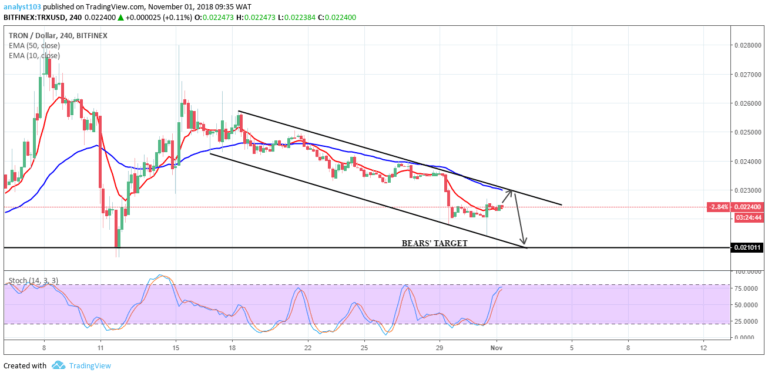
TRX/USD Medium-term Trend: Ranging
- Supply zones: $0.03000, $0.04000, $0.04500
- Demand zones: $0.01000, $0.00900, $0.00800
TRX continues in a range-bound market in its medium-term outlook. The bearish pressure within the range was gradually lost as the year ended with an inverted bearish hammer with TRXUSD closing the year at $0.0920 in the demand area.
The bulls opened with progressive upward move breaking the two EMAs with TRXUSD up at $0.02021on as the journey up north within the range continues. This was further confirmed by the stochastic oscillator signal at 58% and its signal point up and the price above the two EMAs.
TRXUSD is ranging and trading between $0.02200 in the upper supply area and at $0.01880 in the lower demand area of the range. Traders should be patient for a breakout at the upper supply area for buy opportunities or breakdown at the lower demand area for sell opportunities in the medium-term outlook.
TRX/USD Short-term Trend: Bullish
TRX is in a bullish trend in its short-term outlook. The strong bearish pressure ensures that the lower line of the channel was tested on 31st December as previously analyzed with TRXUSD down to $0.01926 in the demand area. The new year saw the bulls stage a return at $0.01913 in the demand area and made a progressive journey to the upper line of the channel at $0.02004 but it later pullback to $0.01924.
A breakout from the channel occurred yesterdat with TRXUSD up at $0.02018. A retest of the channel happens shortly after opening to confirm the upward journey.
The price is above the two EMAs and the stochastic oscillator signal points up at 68% an indication of upward momentum in the cryptocurrency price in the short-term.
The views and opinions expressed here do not reflect that of CryptoGlobe.com and do not constitute financial advice. Always do your own research.


