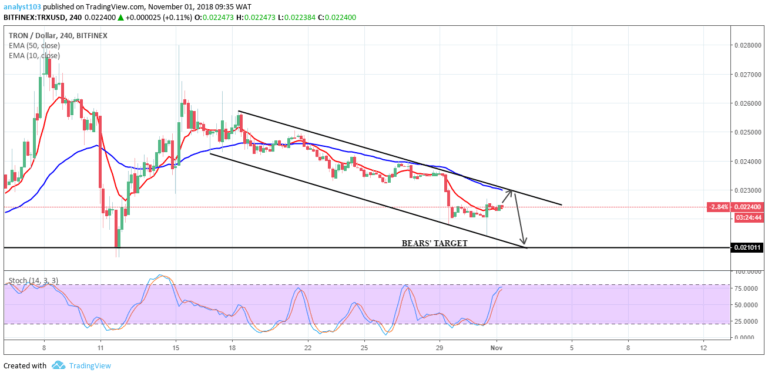
TRX/USD Medium-term Trend: Bearish
- Supply zones: $0.04000, $0.05000, $0.06000
- Demand zones: $0.01000, $0.00900, $0.00800
TRX remains in bearish trend in its medium-term outlook. The bulls gathered momentum for a move to the upside yesterday breaking the two EMAs. TRXUSD was up at $0.02573 in the supply area. But this was shortlived as exhaustion set in indicated by the wicks in the candles an indication that the bears are gradually taking over.
Today’s 4-hour opening candle at $0.02567 was bearish and it broke the two EMAs and pushed the price down to $0.02430 in the demand area.
These activities are around the 23.6 fib area, a trend continuation zone. It there suggests that the downtrend may continue in the medium-term. This was further confirmed by the signal of the stochastic oscillator pointing down at 28% and price is right below the two EMAs. $0.02110 in the demand area remain the bears’ target.
TRX/USD Short-term Trend: Ranging
TRX continues in a range-bound market its short-term outlook. $0.02555 in the supply area was the high attained despite a bullish marubozu candle within the range as the bears’ return. The bearish spinning top formed before the end of the session signaled the market is back in the bears’ control. TRXUSD dropped to $0.02430 in the demand area due to the bearish pressure.
The bulls are gradually staging a return within the range in the short-term with the stochastic oscillator signal pointing up at 26%
TRXUSD is in consolidation and trading between $0.02600 in the upper supply area and at $0.02380 in the lower demand area of the range. Traders should wait for a breakout at the upper supply area or breakdown at the lower area with a retest before a position is taken.
The views and opinions expressed here do not reflect that of CryptoGlobe.com and do not constitute financial advice. Always do your own research


