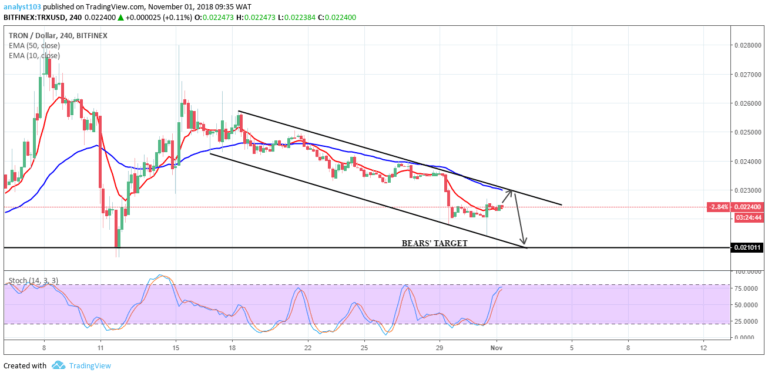
TRX/USD Medium-term Trend: Bearish
- Supply zones: $0.04000, $0.05000, $0.06000
- Demand zones: $0.01000, $0.00900, $0.00800
TRX returns to bearish trend in its medium-term outlook. The loss in bullish momentum at $0.03584 in the supply area brought back the bears. The formation of a bearish spinning top coupled with large bearish candle confirmed the bears market takeover. TRXUSD was initially down to $0.02604 and later to $0.02444 in the demand area around the 50-EMA.
Further downward price movement was rejected at the 50-EMA. With the hammer formation at the demand area, the bulls staged a return as TRXUSD was up at $0.02583 in the supply area.
Despite a bullish 4-hour opening candle at $0.02622 the bearish pressure remained strong as theprice remained below the 10EMA. The price is on the journey toward the 78.2 fib level and the stochastic oscillator in the oversold region at 18% which further establishes the bears’ dominance in the medium-term.
TRX/USD Short-term Trend: Bearish
TRX is in a bearish trend in its short-term outlook. The bulls’ corrective move to the bears’ downward impulsive downward price movement started at $0.02440 in the demand area. TRXUSd rose to $0.02831 in the supply area shortly after today’s opening.
The downward continuation seems to have resumed as the bears’ pressure dropped the crypto down to $0.02512 in the demand area.
The price is below the two EMAs which implies strong bearish pressure and the stochastic oscillator at 18% in the oversold region points to down. It suggests further continuation in the momentum of the price.
$0.023331 in the demand area remains a target for the bears in the short-term as the journey to the south continues.
The views and opinions expressed here do not reflect that of CryptoGlobe.com and do not constitute financial advice. Always do your own research.


