
TRXUSD Long-term Trend – Ranging
- Distribution territories: $0.035, $0.04, $0.045
- Accumulation territories: $0.015, $0.01, $0.005
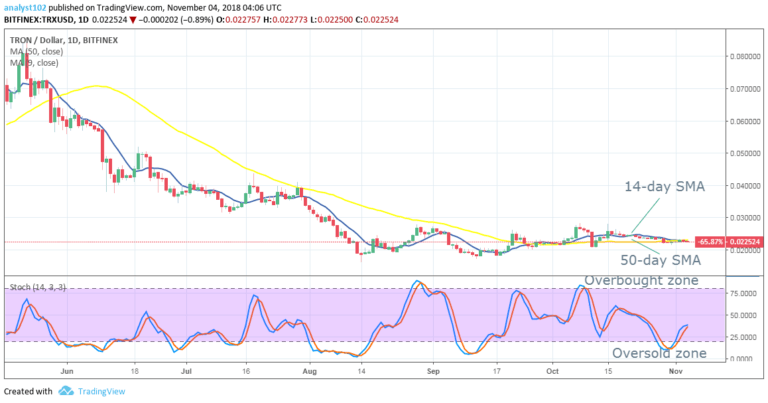
On January 14, TRX’s price saw a surge that took it to the $0.035 mark. Last week, the cryptocurrency dropped from said market to average at about the $0.20 mark, below its 14-day SMA.

After the cryptocurrency’s spike, TRX’s price has seemingly been moving along the trend line of its 14-day SMA, located at about $0.025. The 50-day SMA has been below TRX’s price for about three weeks.
The Stochastic Oscillators are between the 40 and 20 regions, and are seemingly consolidating within them. The $0.02 mark and the 50-day SMA are now believed to be the key support areas that define TRX’s current range. Traders are advised to wait for a strong movement to determine the market’s direction before entering a position.
The views and opinions expressed here do not reflect that of CryptoGlobe.com and do not constitute financial advice. Always do your own research.


