
XMRUSD Medium-term Trend: Ranging
- Supply zones: $120, $130, $140
- Demand zones: $ 40, $30, $20
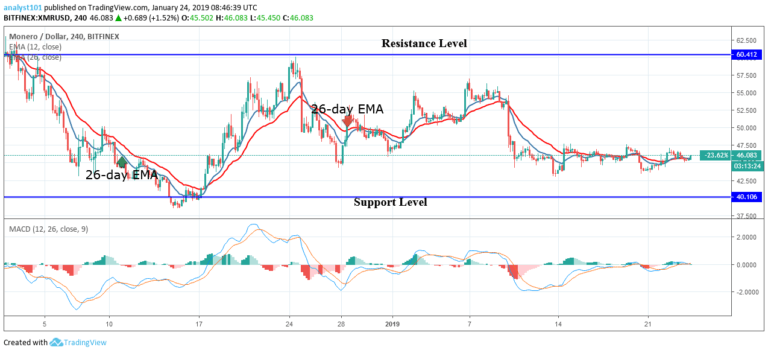
The price of Monero had been consistently trading at the $45 price level since January 10. In fact, it had been range bound since December 2018. On December 14, the price of Monero fell to its low at $39.37 to form the support level. On December 24, the bulls reached the high of $60.05 to form the resistance level.
The XMRUSD pair had been trading between the levels of $40 and $60 since December 2018. Today, the price of Monero is trading above the $45 price level. The range bound movement will continue as long as the price is being resisted by the EMAs. Meanwhile, the crypto’s price is below the 12-day EMA and the 26-day EMA which indicates that the price is in the bearish trend zone.
The MACD line and the signal line are at par with the zero line which indicates a neutral signal.
XMRUSD Short-term Trend: Ranging

On the 1-hour chart, the price of Monero is in a bullish trend zone. The crypto’s price is trading in a tight range on the 1-hour chart. The crypto is trading at the $45 price level but fluctuates between the levels of $44 and $47. The MACD line and signal line are below the zero line which indicates a sell signal.
If the bulls break the $47 price level the crypto will reach the highs of $56 and $60. On the other hand ,If the bears break the $44 price level, the crypto will find support at the $39 price level.
The views and opinions expressed here do not reflect that of CryptoGlobe.com and do not constitute financial advice. Always do your own research.