
 Litecoin Chart by Trading View
LTCUSD Medium-term Trend: Bullish
- Resistance Levels: $60, $65, $70
- Support Levels: $35, $30, $25
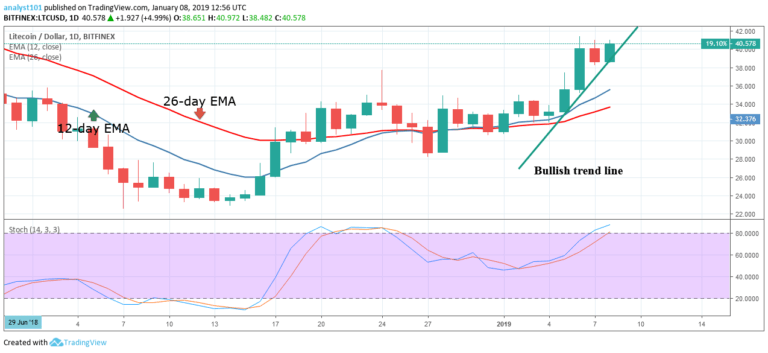
Yesterday, January 7, the price of Litecoin was in a bullish trend. The cryptocurrency had been in a bullish trend zone since December 18, trading above the $30 price level. On January 4, the crypto’s price is making a series of higher highs and higher lows. In an uptrend, this movement is seen on a bullish trend line.
The trend line is drawn to determine the duration of the bullish trend. A bullish trend is ongoing when the price moves on the trend line without breaking it. On the other hand, if the price breaks the trend line and the following candlestick closed on the opposite of it, the current trend is said to be terminated. The bottom line is that the crypto’s price had not been able to break the resistance at $40 price level.
If the bulls break the $40 price level, the crypto will reach the highs of $49 and $56. The Stochastic indicator is in the overbought region above the 80% range which indicates that the price of Litecoin is a bullish momentum and a buy signal.
LTCUSD Short-term Trend: Bullish  Litecoin Chart by Trading View
On the 4-chart, the price of Litecoin is in a bullish trend. The crypto’s price is trending above the 12-day EMA. The price of Litecoin is likely to rise as the price is in the bullish trend zone. However, on January 6 and 8, the crypto’s price is having difficulty in breaking the resistance at $40 price level.
Nevertheless, the Stochastic indicator is approaching the 80% range which indicates that the price of Litecoin is in a bullish momentum and a buy signal.
The views and opinions expressed here do not reflect that of CryptoGlobe.com and do not constitute financial advice. Always do your own research.


