
 Litecoin Chart by Trading View
LTCUSD Medium-term Trend: Ranging
- Resistance Levels: $60, $65, $70
- Support Levels: $30, $25, $20
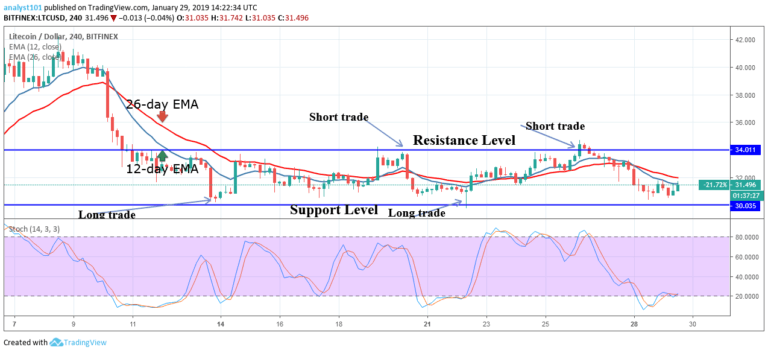
Since January 10, 2019, the LTCUSD pair had been range bound between the levels of $30 and $34.The bulls have consistently defended the support level at the $30 price level. The bears have successfully defended the resistance level at the $34 price level. In this scenario, a trader has to adopt a range bound trading strategy as he waits for the price to breakout or break down at the key levels.
The pointed arrows at the resistance level are where a trader should initiate short trades. Whereas the pointed arrows at the support level are where a trader should initiate long trades. On January 28, a Doji candlestick has appeared signifying a reversal of the bearish trend. A trader should initiate a long trade and exit your trade near the resistance zone.
Meanwhile, the Stochastic is in the oversold region but above the 20% range which indicates that the crypto is in a bullish momentum and a buy signal.
LTCUSD Short-term Trend: Bullish
 Litecoin Chart by Trading View
On the 1-hour chart, the price of Litecoin is in a bullish trend. The bulls have broken the 12-day EMA, the 26-day EMA and reached above the bullish trend zone. If the price is sustained, the crypto will reach the $34 price level which is a resistance level. Meanwhile, the stochastic is above the 60% range which indicates that the price of Litecoin is in a bullish momentum and a buy signal.
The views and opinions expressed here do not reflect that of CryptoGlobe.com and do not constitute financial advice. Always do your own research.


