
 Litecoin Chart by Trading View
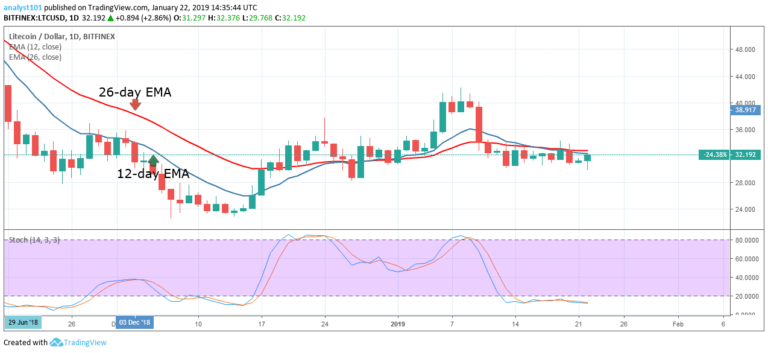
LTCUSD Medium-term Trend: Ranging
- Resistance Levels: $60, $65, $70
- Support Levels: $30, $25, $20
The LTCUSD pair is in a range bound movement since January 13. On January 10 and 11, the bears broke the 12-day EMA, the 26-day EMA and the price fell to the low of $32. The crypto’s price depreciated further to the low of $31 and commenced a range bound movement. Today, a bullish candlestick is testing the EMAs, which if resisted would result in a range bound movement.
Meanwhile, the Stochastic is in the oversold region but below the 20% range which indicates that the crypto is in a strong bearish momentum and a sell signal.
LTCUSD Short-term Trend: Bullish
 Litecoin Chart by Trading View
On the 4-hour chart, the price of Litecoin is in a sideways trend. The cryptocurrency is range bound between the levels of $30 and $34. On January 19, the crypto’s price reached the $0.34 price level and the bulls were resisted at the $0.34 price level. On January 20, the bears brought the price to its low at $31. The crypto’s price has been ranging at the $31 price level in the last 48 hours.
Today, the crypto is rising and may face resistance at the 12-day EMA. On the upside, if the bulls break the EMAs, the crypto will test the resistance level. On the downside, if the bulls were repelled, the crypto will continue its range bound movement.The Stochastic indicator is in the oversold region but above the 20% range which indicates that the price of Litecoin is in a bullish momentum and a buy signal.
The views and opinions expressed here do not reflect that of CryptoGlobe.com and do not constitute financial advice. Always do your own research.


