
 Litecoin Chart by Trading View
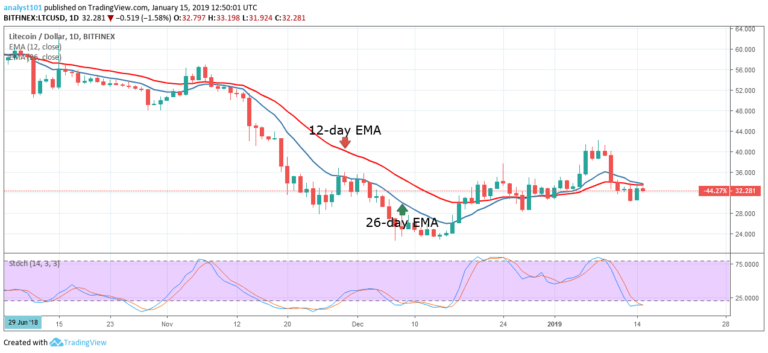
LTCUSD Medium-term Trend: Bullish
- Resistance Levels: $60, $65, $70
- Support Levels: $30, $25, $20
Yesterday, the price of Litecoin was in the bearish trend zone, as the crypto fell to the low of $30. On January 14, the bulls were unable to break above the 12-day EMA and the 26-day EMA. Today, the crypto’s price is being resisted by the 26-day EMA as the crypto is in a downtrend.
Litecoin price is below the 12-day EMA and the 26-day EMA, so there is the likelihood of price falling. The Stochastic indicator is in the oversold region and below the 20% range which indicates that the price of Litecoin is in a strong bearish momentum and is a sell signal.
LTCUSD Short-term Trend: Bullish
 Litecoin Chart by Trading View
On the 4-chart, the price of Litecoin is in a bearish trend zone. The Stochastic indicator is below the 80% range and it is making a U-turn which indicates that the price of Litecoin is in a bearish momentum and a sell signal.
The views and opinions expressed here do not reflect that of CryptoGlobe.com and do not constitute financial advice. Always do your own research.


