
 Ethereum Chart By Trading View
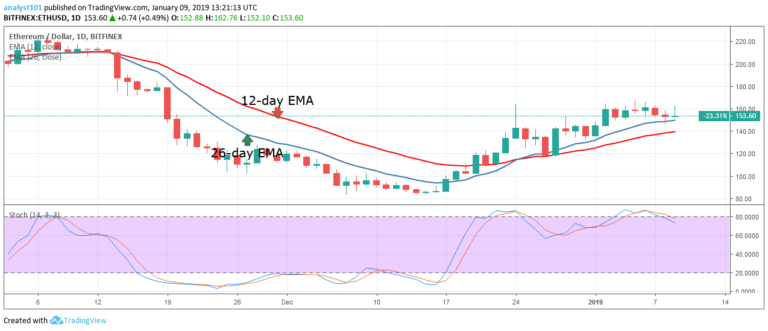
ETHUSD Medium-term Trend: Bullish
- Resistance Levels: $230, $240, $250
- Support Levels: $150, $130, $110
Yesterday, the price of Ethereum was in a bearish trend. The ETH price closed at a price of $152.58 yesterday. The crypto’s price fell to the support of the 12-day EMA. Prior to this time, the crypto’s price had been resisted at the $160 price level on three occasions. The bulls were unable to break the $160 price level.
If the bulls had broken the $160 price level, the crypto would have risen to the high of $220. However, the crypto fell to the low of $152.58 yesterday. On the downside, if the bears break the $150 price level, the crypto will fall to the low of $135. Today, the price of Ethereum is making another bullish movement to test the resistance level.
Meanwhile, the stochastic indicator is out of the overbought region but below the 80% range which indicates that the price of Ethereum is in a bearish momentum and a sell signal.
ETHUSD Short-term Trend: Bearish
 Ethereum Chart By Trading View
On the 4-hour chart, the price of Ethereum is in a bearish trend zone. Today, the crypto’s price reached the high of $162.76 but was repelled. The bears broke the 12-day EMA and the 26-day EMA to the low of $154.19. Nevertheless, the crypto’s price is likely to fall because the price is in the bearish trend zone.
Meanwhile, the stochastic indicator is below the 60% range but the blue band is making a U-turn. This indicates that the price of Ethereum is in a bullish momentum but the bulls appears to have exhausted their bullish pressure.
The views and opinions expressed here do not reflect that of CryptoGlobe.com and do not constitute financial advice. Always do your own research.


