
 Ethereum Chart By Trading View
ETHUSD Medium-term Trend: Bearish
- Resistance Levels: $230, $240, $250
- Support Levels: $110, $100, $90
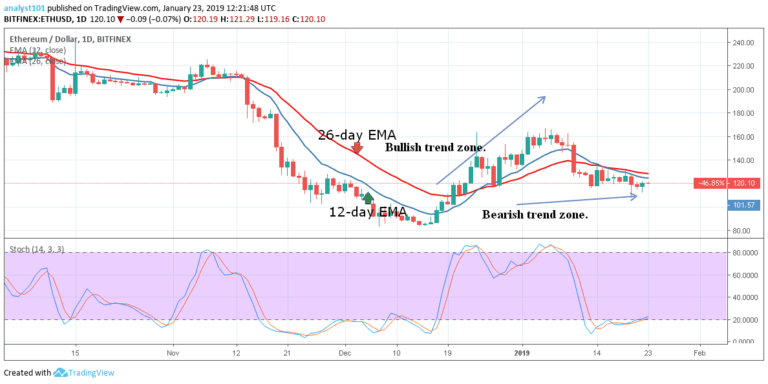
From the daily chart analysis, the price of Ethereum had been divided into two zones by the exponential moving averages. On December 17, 2018, to January 6, 2019, is the era of the bullish trend zone. The crypto’s price can reach a high of $165 and above. On January 7, the bears broke below the 12-day EMA, 26-day EMA and price fell to the low of $129.50.
Therefore, as from January 10 to date, any price below the EMAs is in the bearish trend zone. It is only in exceptional cases where the EMAs have been broken above. Today, the crypto’s price is below the EMAs, and the price is approaching the $120 price level. The crypto cannot rise above the $130 price level. On the upside, the crypto can resume its bullish trend when the bulls break the EMAs and the price is sustained above it.
ETHUSD Short-term Trend: Bearish
 Ethereum Chart By Trading View
On the 4-hour chart, the price of Ethereum is in a bearish trend zone. The 26-day EMA is resisting the small body candlesticks like the Doji and the spinning tops. The appearances of these candlesticks describe the indecision between the buyers and sellers at the $120 price level.
Meanwhile, the stochastic indicator is approaching the overbought region above the 80% range which indicates that ETH is in a strong bullish momentum and a buy signal.
The views and opinions expressed here do not reflect that of CryptoGlobe.com and do not constitute financial advice. Always do your own research.


