
 Ethereum Chart By Trading View
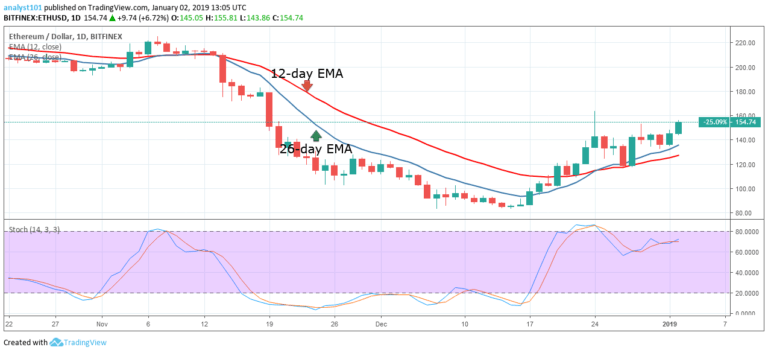
ETHUSD Medium-term Trend: Bullish
- Resistance Levels: $230, $250, $270
- Support Levels: $150, $130, $110
Yesterday, the price of Ethereum was in a bullish trend. Since December 20, the price of Ethereum has been in the bullish trend zone. In other words, the cryptocurrency has the tendency to rise while in the bullish trend zone. Yesterday, January 1, the crypto’s price was in a bullish trend as it reached the high of $145 price level.
Today, the crypto’s price is above the $150 price level but it is approaching the resistance level at $ 160. On December 24, the bulls were resisted at the resistance of $163.50 price level. However, if the bulls break the resistance at $163.50, the crypto will reach the highs of $180 and $200 price level.
Meanwhile, the stochastic indicator is above the 60% range which indicates that the ETH price is in a bullish momentum and a buy signal.
ETHUSD Short-term Trend: Bullish
 Ethereum Chart By Trading View
On the 4-hour chart, the price of Ethereum is in a bullish trend. Since December 28, the crypto’s price had been range bound. The crypto’s price had been fluctuating above the 12-day EMA and the 26-day EMA. On January 1, the ETH price commenced a bullish movement at the $138.33 price level.
A trend line is drawn to determine the duration of the trend. The ETH price is making a series of higher highs and higher lows on the trend line. This bullish movement is said to be ongoing. However, if the crypto’s price breaks the trend line and the following candlestick closes opposite it, the trend will be over.
The views and opinions expressed here do not reflect that of CryptoGlobe.com and do not constitute financial advice. Always do your own research.


