
 Ethereum Chart By Trading View
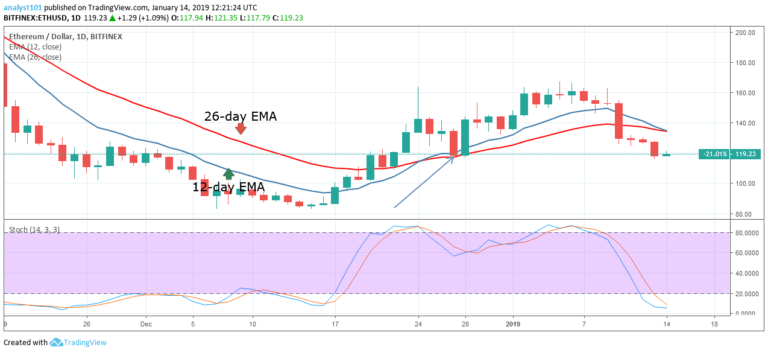
ETHUSD Medium-term Trend: Bearish
- Resistance Levels: $230, $240, $250
- Support Levels: $110, $100, $90
Last week, the price of Ethereum was in a bullish trend as the crypto made unsuccessful attempts to break the $160 resistance level. On January 10, the bears broke the 12-day EMA, the 26-day EMA and the price fell to the low of $129.50 price level. Later the crypto further depreciated to the low of $117.94.
This was the previous low of December 27, where the bearish trend made a reversal. On the upside, if the bulls take possession of price, the crypto will rise and reach the previous levels of $140 and $ 165. On the downside, if the bears break the $117.94 price level, the crypto’s price will fall the previous lows of $102 and $110.
Meanwhile, the stochastic indicator is in the oversold region but below the 20% range which indicates that the price of Ethereum is in a bearish momentum and a sell signal.
ETHUSD Short-term Trend: Bearish
 Ethereum Chart By Trading View
On the 4-hour chart, the price of Ethereum was in a bearish trend zone. On January 10, the bears broke the 12-day EMA, the 26-day EMA and price fell to $127.44. At the low of $127.44, the crypto was making a range bound movement where it was resisted and the price fell to the low of $116.79.
If this support level holds the bulls will commence a bullish movement to the bullish trend zone. Meanwhile, the stochastic indicator is out of the oversold region but above the 20% range. This indicates that the price of Ethereum is in a bullish momentum and a buy-sell signal.
The views and opinions expressed here do not reflect that of CryptoGlobe.com and do not constitute financial advice. Always do your own research.


