
 Ethereum Chart By Trading View
ETHUSD Medium-term Trend: Bullish
- Resistance Levels: $230, $240, $250
- Support Levels: $120, $110, $90
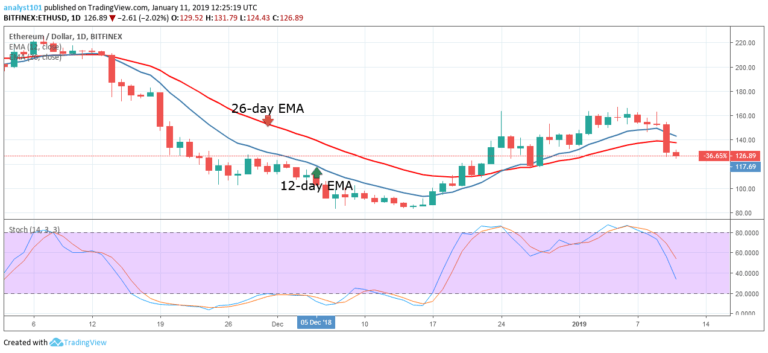
The price of Ethereum was in a bearish trend as the crypto fell below the bearish trend zone. The ETH price fell because of its inability to break the $160 price level. The crypto fell after three unsuccessful attempts at the resistance. The price of Ethereum is now below the 12-day EMA and the 26-day EMA indicating that the price of Ethereum is likely to depreciate.
The crypto’s price is currently trading at the $126 price level. However, if the bears break the $120 price level, the crypto will find support at the $102 and $110 price levels. Meanwhile, the stochastic indicator is out of the overbought region but below the 40% range which indicates that the price of Ethereum is in a bearish momentum and a sell signal.
ETHUSD Short-term Trend: Bearish
 Ethereum Chart By Trading View
On the 4-hour chart, the price of Ethereum is in a bearish trend zone. The bears broke the 12-day EMA and the 26-day EMA to the low of $126.68 price level. The 12-day EMA and the 26-day EMA are trending southward indicating the bearish trend. Meanwhile, the stochastic indicator is in the oversold region below the 20% range as the blue and red bands are horizontally flat.
This indicates that the price of Ethereum is in a strong bearish momentum and a sell signal.
The views and opinions expressed here do not reflect that of CryptoGlobe.com and do not constitute financial advice. Always do your own research.


