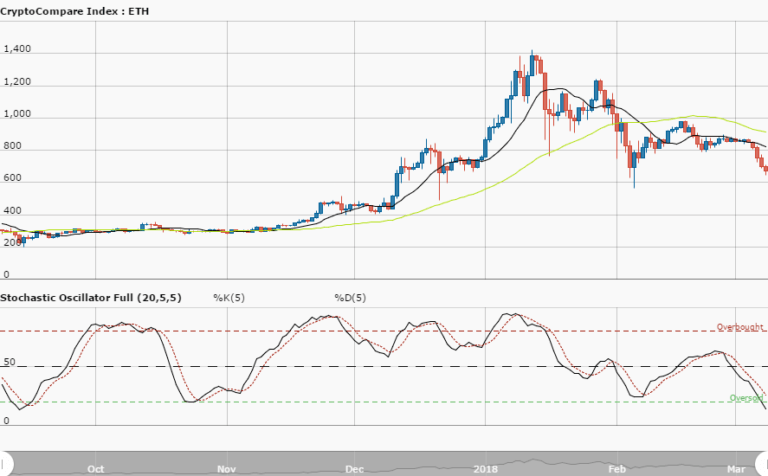
ETHUSD Long-term Trend – Bearish
- Distribution territories: $200, $220, $240
- Accumulation territories: $90, $70, $50
On January 10, Ethereum’s price went through a notable decline after it was trading along the $160 mark. The cryptocurrency failed to push past said mark after trading between the $160 and $140 range, and ended up falling below it.
The cryptocurrency’s 14-day SMA is bent southwards while being over the 50-day SMA. The Stochastic Oscillators are trying to move into the oversold zone, which indicates the bear market may be about to return.
There’s a possibility the cryptocurrency will now start trading between the $120 and $100 marks. If the $100 mark is to be breached southwards, the cryptocurrency may go down to the $80 mark. While we figure it out, traders can be on the lookout for a decent position to enter the market.
The views and opinions expressed here do not reflect that of CryptoGlobe.com and do not constitute financial advice. Always do your own research.


