

ADAUSD Medium-term Trend: Ranging
- Resistance levels: $0.080, $0.090, $0.100
- Support levels: $0.040, $0.030, $0.020
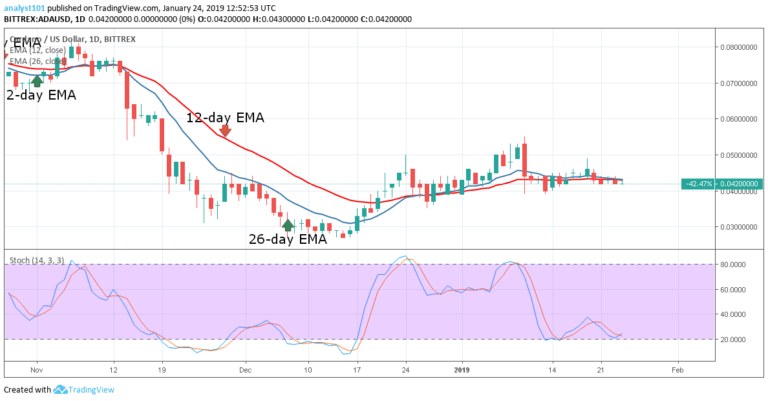
Since January 13, the price of Cardano had been in a sideways trend. On January 13, the crypto fell and closed at a price of $0.0400. Then the crypto’s price commenced its fluctuations below and above the horizontal line. The 12-day EMA and the 26-day EMA are the horizontal lines which indicates that the crypto’s price is in a sideways trend.
The crypto fluctuates between the levels of $0.0400 and $0.0460. Today, the crypto’s price is rising but being resisted by the EMAs. A price breakout is imminent as the crypto’s price is in a tight range. Meanwhile, the stochastic is above the 20% range which indicates that the crypto is in a bullish momentum and a buy signal.
ADAUSD Short-term Trend: Ranging

On the 4-hour chart, the crypto’s price is in a sideways trend. In the last week, the crypto fluctuated below and above the EMAs without breaking the support and the resistance levels. Today, the price of Cardano is falling and approaching the price of $0.0420 which had been the previous low before a bullish candlestick forms.
Meanwhile, the crypto is likely to fall as the price is below the EMAs. Also, the stochastic is in the oversold region and below the 20% range which indicates that the crypto is in a bearish momentum and a sell signal.
The views and opinions expressed here do not reflect that of CryptoGlobe.com and do not constitute financial advice. Always do your own research.


