

BTCUSD Medium-term Trend: Ranging
- Resistance levels: $7,000, $7,200, $7,400
- Support levels: $3,800, $3,300, $3,100
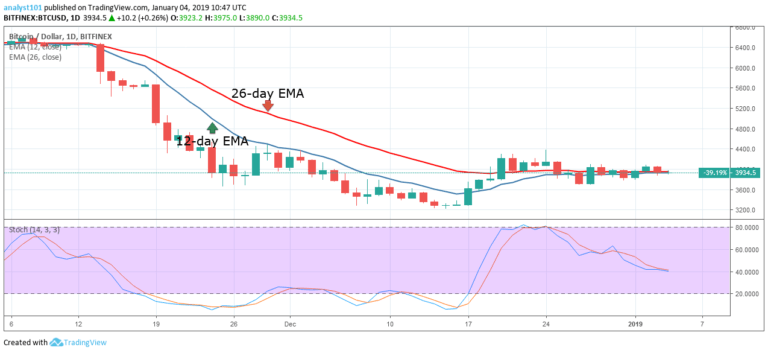
Yesterday, the BTC price was fluctuating above the $3,900 price level. Today, the crypto’s price is still range bound above the $3,900 price level. The BTC price is characterized by the appearance of small body candlesticks like the Doji and Spinning tops describing the indecision of buyers and sellers at the $3,900 price level.
The 12-day EMA and the 26-day EMA are horizontally flat describing the price action as very choppy. The resistance level and the support level of the crypto are not evenly apart. However, a price break out is expected in a couple of days to come. Meanwhile, the stochastic indicator is out of the overbought region but below 60% range which indicates that Bitcoin is in a bearish momentum and a sell signal.
BTCUSD Short-term Trend: Bearish

On the 4-hour chart, the crypto’s price is in a bearish trend zone. Yesterday, the bears broke the 12-day EMA and the 26-day EMA to the low of $3,917.40 and the bulls commenced a bullish movement to the EMAs. The EMAs are acting as resistance to the price of Bitcoin as the crypto falls back.
The BTC price is below the 12-day EMA and the 26-day EMAs which indicates that price is likely to fall. Also, the Stochastic indicator is out of the overbought region but below the 40% range. This indicates that Bitcoin is in a bearish momentum and a sell signal.
The views and opinions expressed here do not reflect that of CryptoGlobe.com and do not constitute financial advice. Always do your own research.


