

BTCUSD Medium-term Trend: Ranging
- Resistance levels: $7,000, $7,200, $7,400
- Support levels: $3,500, $3,300, $3,100
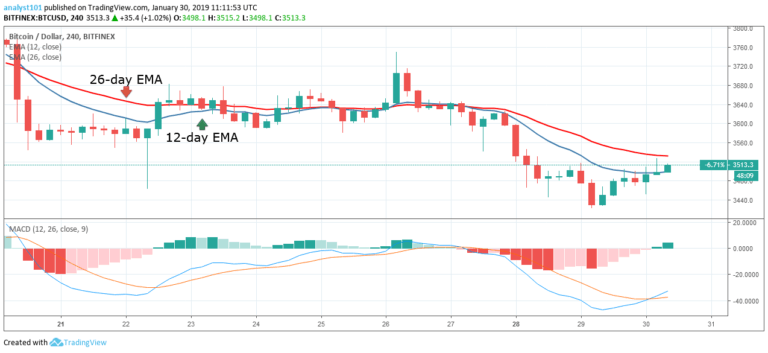
The price of Bitcoin is in the bearish trend zone. On January 29, the crypto fell to the low of $3,430.10 and commenced a bullish movement. The bulls have broken the 12-day EMA but were yet to break the 26-day EMA. On the upside, if the bulls break above the EMA and the price is sustained above it, the crypto will return to the $3,500 price level but may face resistance at the $3,600 price level.
On the downside, if the crypto falls below the $3,400 price level, the crypto will revisit the previous lows of $3,200 or $3,000. Meanwhile, the MACD line and the signal line are below the zero line which indicates a sell signal.
BTC/USD Short-term Trend: Bullish

On the 1-hour chart, the price of Bitcoin is in the bullish trend zone. Yesterday, January 29, the price of Bitcoin fell to a low of $3,430.10 and commenced a bullish movement to break the EMAs. The bulls were resisted by the 26-day EMA. Today, the bulls were able to break above the EMAs and commenced a bullish trend.
The bullish trend was making a series of higher highs and higher lows. A trend line is drawn showing the support levels of price where traders can initiate long trades. Meanwhile, the current bullish trend has been terminated by a bearish candlestick. A bullish trend is terminated because the bullish trend line has been broken and the following candlestick closed on the opposite of it.
Meanwhile, the BTC price is above the 12-day EMA and the 26-day EMA which indicates that the price is likely to rise. The Stochastic is above the 60% range which indicates that the price is in a bullish momentum and a buy signal.
The views and opinions expressed here do not reflect that of CryptoGlobe.com and do not constitute financial advice. Always do your own research.


