
Dummy text. Please change.

BTCUSD Medium-term Trend: Ranging
- Resistance levels: $7,000, $7,200, $7,400
- Support levels: $3,500, $3,300, $3,100
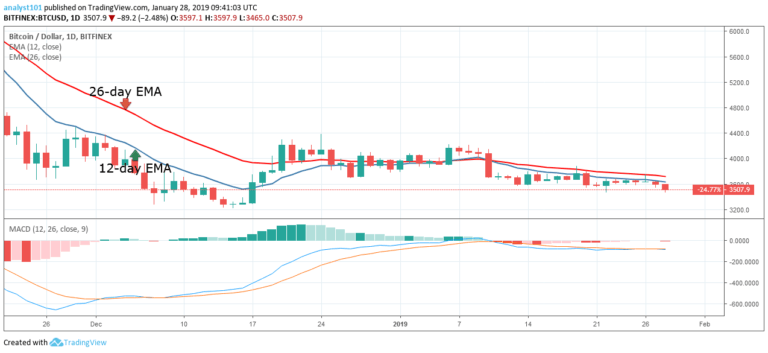
Last week the BTCUSD pair was in the bearish trend zone. Since January 10, the bulls have not been able to break above the EMAs . From the daily chart, the 12-day EMA provides resistance to the crypto’s price. However, as long as the BTC price is below the EMAs, the crypto is likely to fall.
Today, the crypto’s price is in the bearish trend zone and the price is falling below the $3,500 price level. The crypto will find support at the previous lows of $3,200 or $3,000 if the bears break the $3,500 price level. Traders should initiate long trades at the price of $3,200 or $3,000 if the crypto falls and tests those levels. The MACD line and the signal line are below the zero line which indicates a sell signal.
BTC/USD Short-term Trend: Bearish

On the 4-hour chart, the price of Bitcoin is in the bearish trend zone. Last week neither the bulls nor the bears broke the critical levels of the price range. On January 22, the bulls broke the 12-day EMA, the 26-day EMA and the crypto reached the bullish trend zone. The crypto fluctuated below and above the EMAs but reached the high of $3,750 .
On January 26, the bears pulled back the price and broke the EMAs as the price fell to the low of $3,590. The bears are approaching the $3,500 price level. The crypto’s price is below the 12-day EMA and the 26-day EMA which indicates that the price is likely to fall. The Stochastic is now in the oversold region and below the 20% range which indicates that the price is in a strong bearish momentum and a sell signal.
The views and opinions expressed here do not reflect that of CryptoGlobe.com and do not constitute financial advice. Always do your own research.


