

BTCUSD Medium-term Trend: Bearish
- Resistance levels: $7,000, $7,200, $7,400
- Support levels: $3,500, $3,300, $3,100
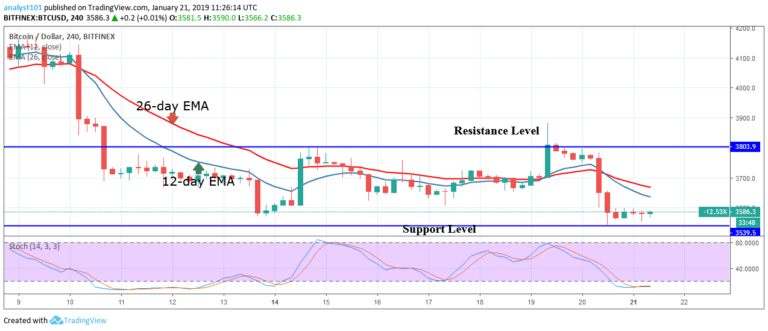
Last week, the BTCUSD pair was in the bullish trend zone as the price of Bitcoin reached the high of $ 3,882.0. However, the crypto’s price fell because of the resistance at the $3,800 price level. On January 20, the bears broke the 12-day EMA , the 26-day EMA and the price fell to the low $3,566.10.
From the price action, the BTC price is below the 12-day EMA and the 26-day EMA which indicates that the price of Bitcoin is likely to fall. The exponential moving averages are pointing downward. In addition, the stochastic bands are in the oversold region but below the 25% range which indicates that the crypto is in a strong bearish momentum and a sell signal.
In view of this, if the price falls and breaks the $3,500 price the crypto will revisit the previous low of $3,200. On the upside, if this level holds, the crypto will continue its range bound movement between the levels $3,500 and $3,800.
BTC/USD Short-term Trend: Bearish

On the 1-hour chart, the price of Bitcoin is in the bearish trend zone. Yesterday, the bears broke the 12-day EMA, the 26-day EMA and the price fell to the support at $3,479.80. The crypto’s price is fluctuating above the $3,479 price level. The BTC price has small body candlesticks such as Doji and Spinning tops describing the indecisions of buyers and sellers at the $3, 500 price level.
Meanwhile, the crypto’s price is still below the EMAs indicating that the BTC price is likely to fall. Also, the stochastic is below the 60% range which indicates that the BTC price is in a bearish momentum and a sell signal.
The views and opinions expressed here do not reflect that of CryptoGlobe.com and do not constitute financial advice. Always do your own research.


