

BTCUSD Medium-term Trend: Ranging
- Resistance levels: $7,000, $7,200, $7,400
- Support levels: $3,800, $3,300, $3,100
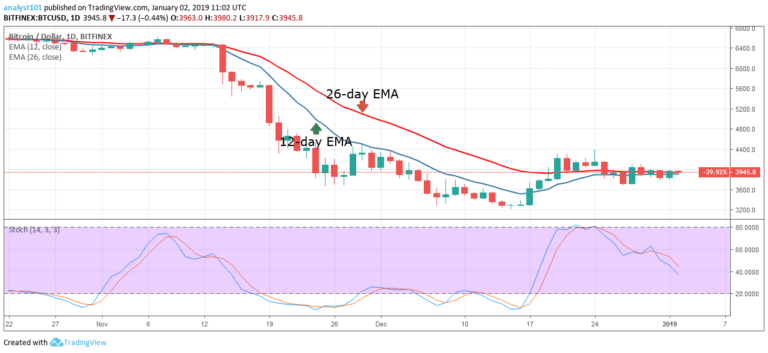
In the last five days, the price of Bitcoin had been fluctuating between the $3,800 and $3,900 price levels. The 12-day EMA and the 26-day EMA are horizontally flat indicating that price is in a sideways trend. The crypto’s price is neither below nor above the EMAs indicating that price is also ranging.
Meanwhile, the two critical levels to watch out for are the $3,700 and $3,900 price levels. If the crypto’s price falls and breaks the $3,700 price level, the downtrend is likely to resume. Similarly, if the bulls break the $4,000 price level, the crypto will reach the previous highs of $4,200 and $4,400 price levels.
BTCUSD Short-term Trend: Ranging

On the 4-hour chart, the crypto’s price is in a sideways trend. In the last week, the crypto’s price fluctuated above and below the 12-day EMA and the 26-day EMA. Yesterday, the BTC price fluctuated above the EMAs to reach the high of $3,956.30. Today, the BTC price is retracing to the 26-day EMA.
Meanwhile, the Stochastic indicator is approaching the overbought region but below the 80% range. This indicates that Bitcoin is in a bullish momentum and has a buy signal.
The views and opinions expressed here do not reflect that of CryptoGlobe.com and do not constitute financial advice. Always do your own research.


