
BTCUSD Medium-term Trend: Bearish
- Resistance levels: $7,000, $7,200, $7,400
- Support levels: $3,600, $3,600, $3,400
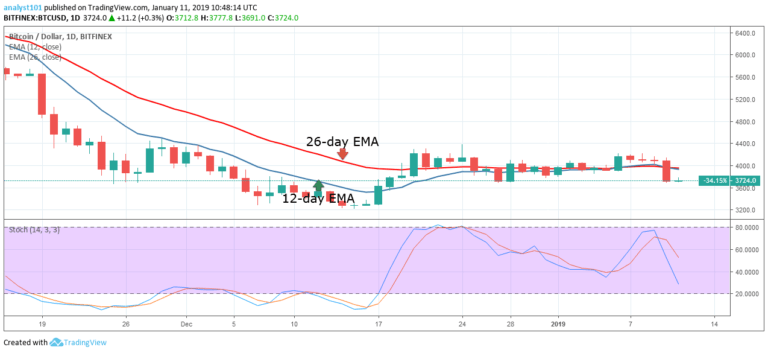
Yesterday, the price of Bitcoin was in the bullish trend zone as it fell from the high of $ 4200 to $3,700 . The price of Bitcoin fell because it had been struggling to break the $4,200 price level. Now the bottom line is that BTC price has fallen below the 12-day EMA and the 26-day EMA which indicates that price is likely to fall.
If the bearish trend continues price may revisit the December 7 low of $3,460 price level. Also, if price breaks the $3,400, Bitcoin will find support at the $3,200 price level. The stochastic is below the 40% range which indicates that Bitcoin is in a bearish momentum and a sell signal.
BTC/USD Short-term Trend: Bearish

On the 4-hour chart, the price of Bitcoin is in a bearish trend zone. On January 10, the bears broke the 12-day EMA, the 26-day EMA and the crypto fell to the low of $3,712.80. The 12-day EMA and the 26-dayEMA are pointing southwards indicating the bearish trend. From the price action, the bullish candlesticks have broken the bearish trend line indicating that the bearish pressure is over.
The assumption is that if price breaks the trend line and the following candlesticks closed on the opposite of it, the current trend is said to be terminated. Traders can look out for a buy setups to initiate long trades in anticipation of a bullish trend.Although, the stochastic is below the 20% region which indicates that the BTC price is in a strong bearish momentum and a sell signal.
The views and opinions expressed here do not reflect that of CryptoGlobe.com and do not constitute financial advice. Always do your own research.


