

XRPUSD Medium-term Trend: Ranging
Resistance Levels: $0.56, $0.58, $ 0.60
Support Levels: $0.36, $0.34, $0.32
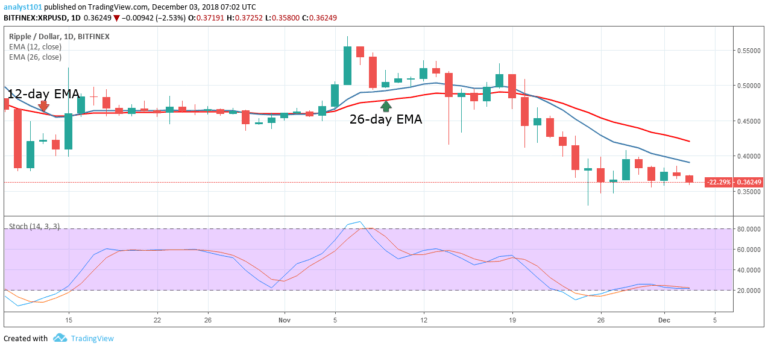
On the daily chart, XRP’s price has been on a sideways trend. Last week, the cryptoasset’s price fell to a low of $0.36 and start moving around that level. It’s currently still below the 12-day EMA and the 26-day EMA, indicating it will likely continue moving down. Today, XRP is currently at the $0.36 mark.
If the downward trend is to continue, XRP will see lows around the $0.24 and $0.28 marks. If it does fall traders should enter long positions anticipating a potential bullish trend. If the $0.36 level holds, the price will keep on moving within its current range until it eventually moves upward. The Stochastic is currently above the 20%, indicating the price is moving sideways.
XRPUSD Short-term Trend: Bearish

On the short-term, XRP is in a bearish trend. On December 1, the price made a pullback to a high of $0.37 and entered a range bound movement. Today, the 12-day EMA acted as a resistance for the price and the crypto resumed its downward trend. The Stochastic is in a bearish momentum and it is above 20% range.
The views opinions expressed here do not reflect that of CryptoGlobe.com and do not constitute financial advice. Always do your own research.


